Revisiting Security+ Controls Through an AWS and Splunk Homelab
I earned the CompTIA Security+ certification a few years ago. However, I wanted to review some of the material without simply rereading certification notes or working through practice questions. I already had an AWS-based Splunk homelab that I built for hands-on Splunk, Linux, and cloud work, so I decided to use that instead.
For this post, I am looking back at the lab through three familiar Security+ control categories: preventive, detective, and corrective. I am not trying to map every Security+ objective to something in the environment. The idea is simply to use systems I have already configured and tested as a reference while reviewing the underlying concepts.
That makes the material easier for me to retain. Knowing that a firewall is a preventive control is straightforward. It becomes more useful when I can point to a specific firewall, explain where it sits, describe what it should block, and identify the logs I would check afterward.
Environment
The homelab runs Splunk Enterprise across multiple Ubuntu EC2 instances in AWS. I separated the major Splunk functions rather than using one all-in-one instance, with systems dedicated to indexing, search, management, deployment, and forwarding.
Universal Forwarders collect host data from the Ubuntu systems. I also use a Heavy Forwarder for AWS data ingestion.
I documented the build in more detail in an earlier post, so I am reusing the architecture diagram and one of the dashboards here rather than covering the Splunk deployment again.
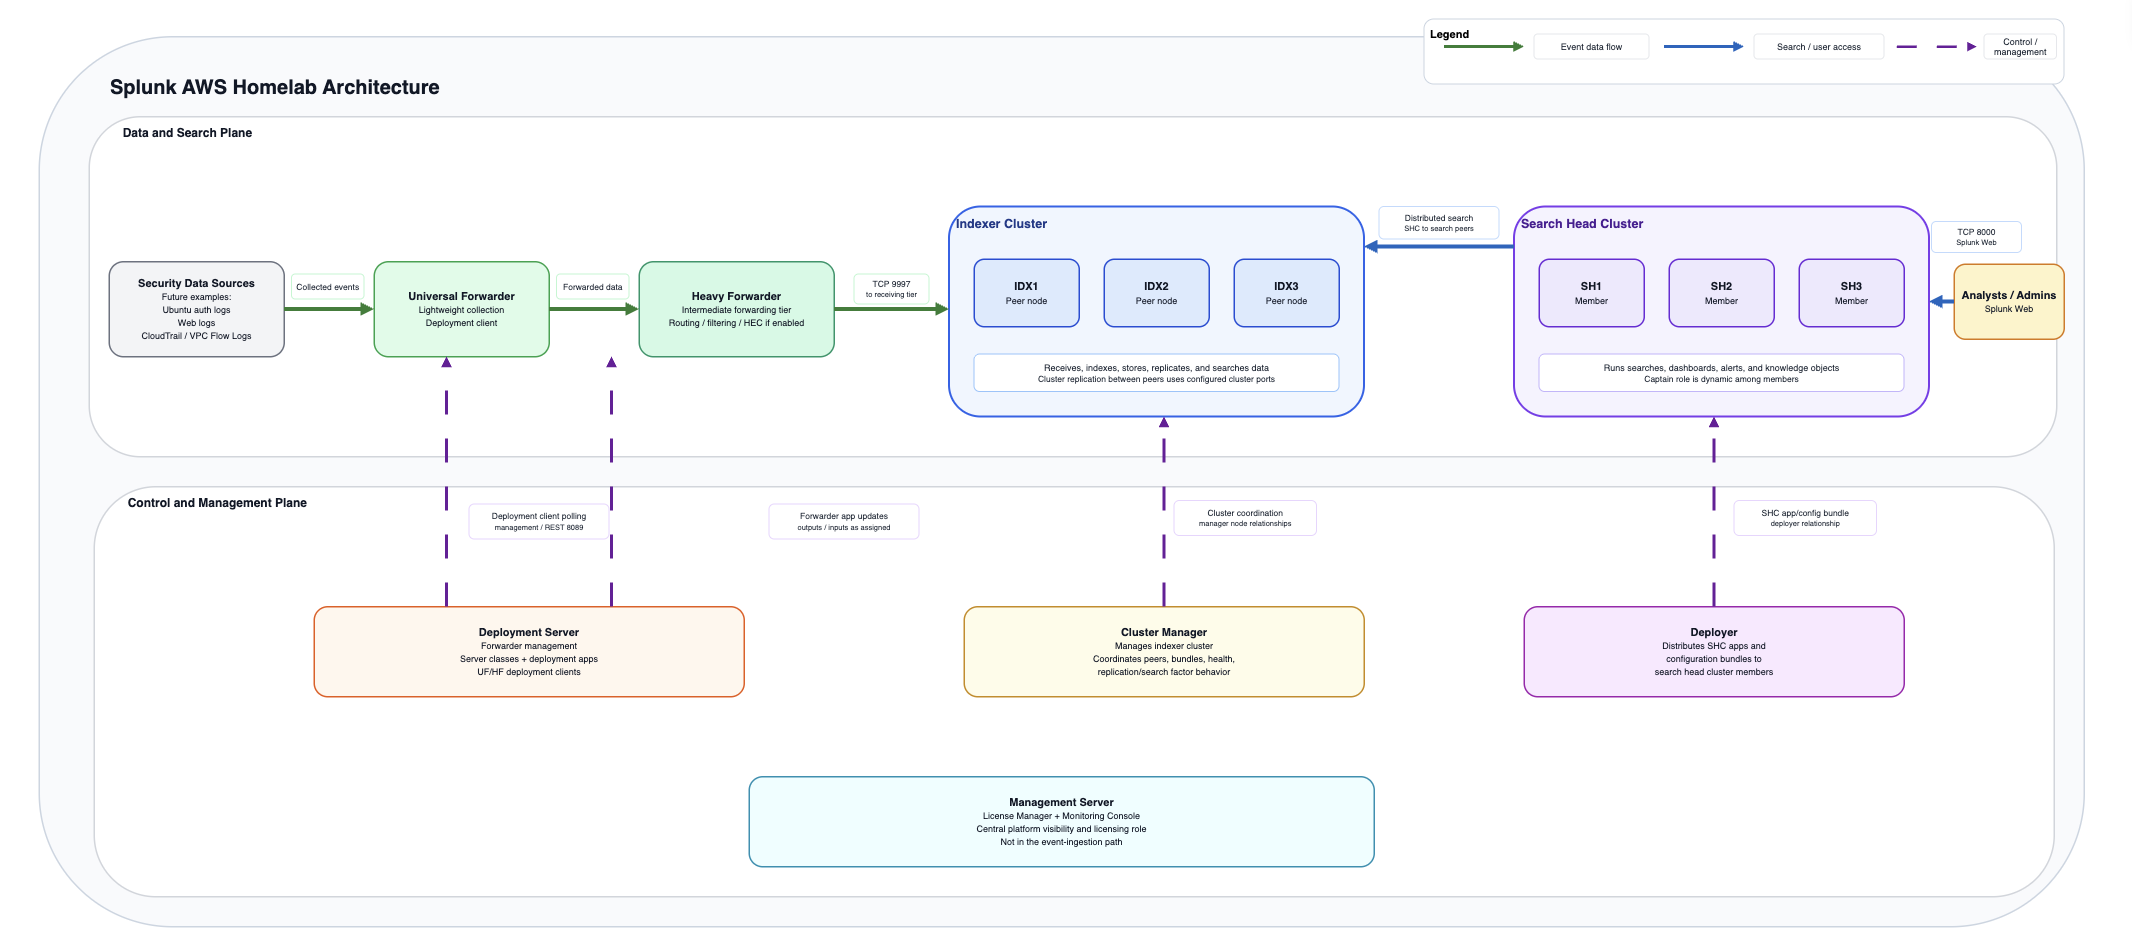
Figure 1: High-level architecture of the AWS and Splunk homelab.
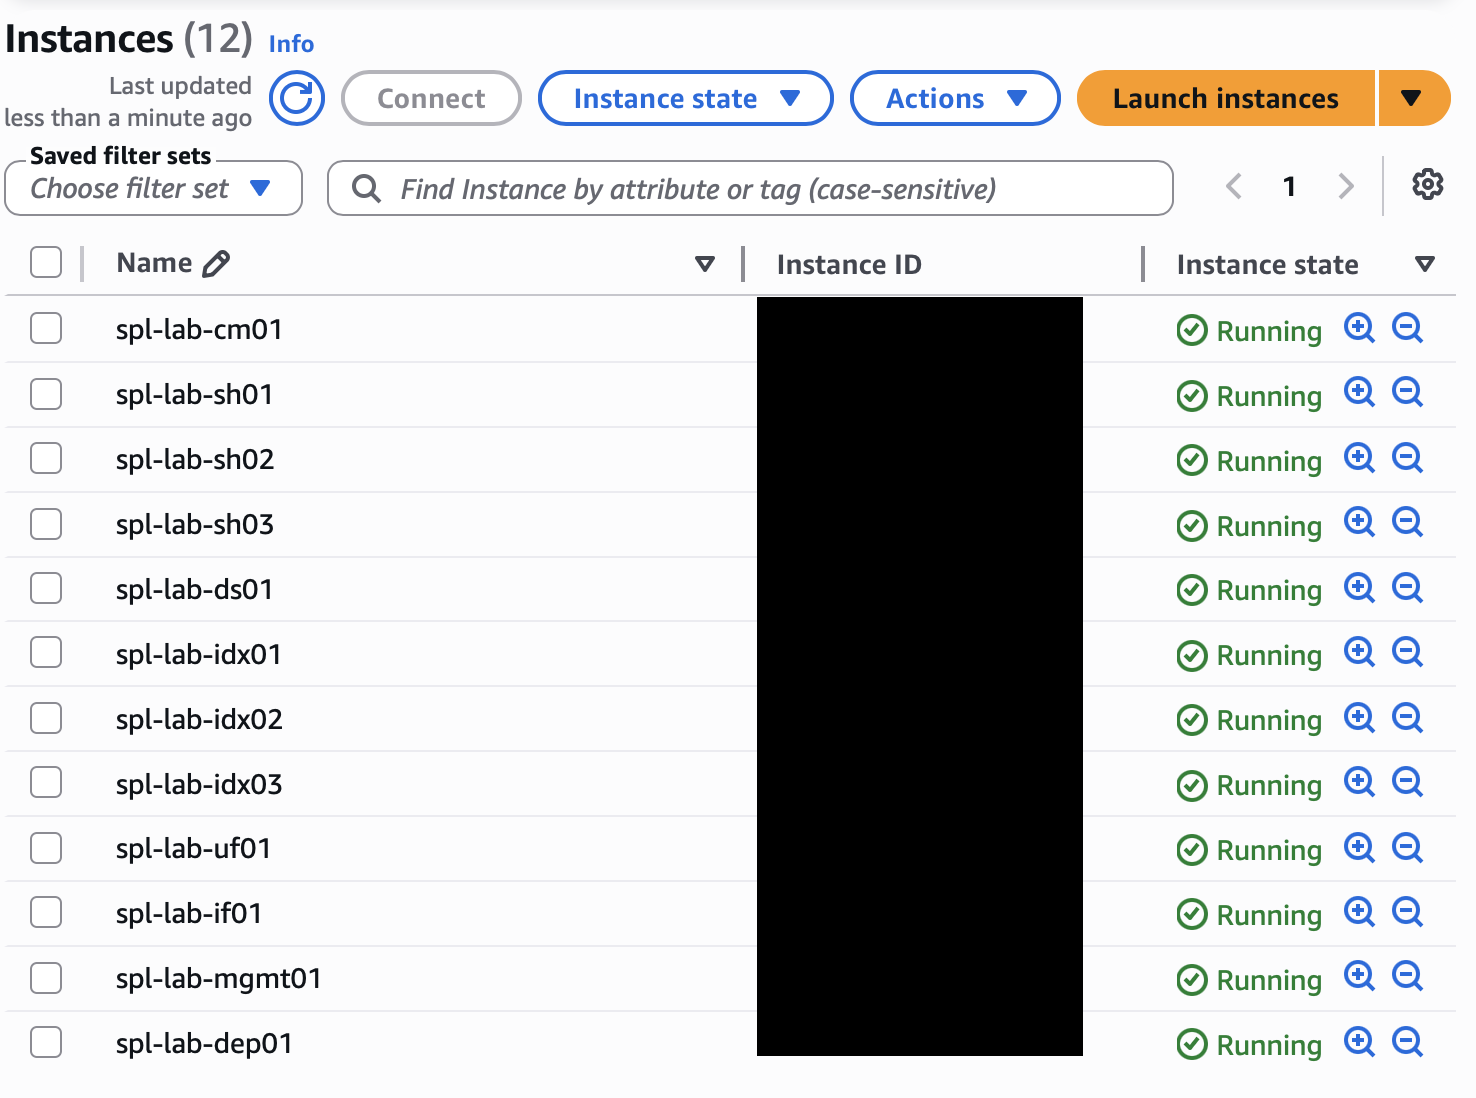
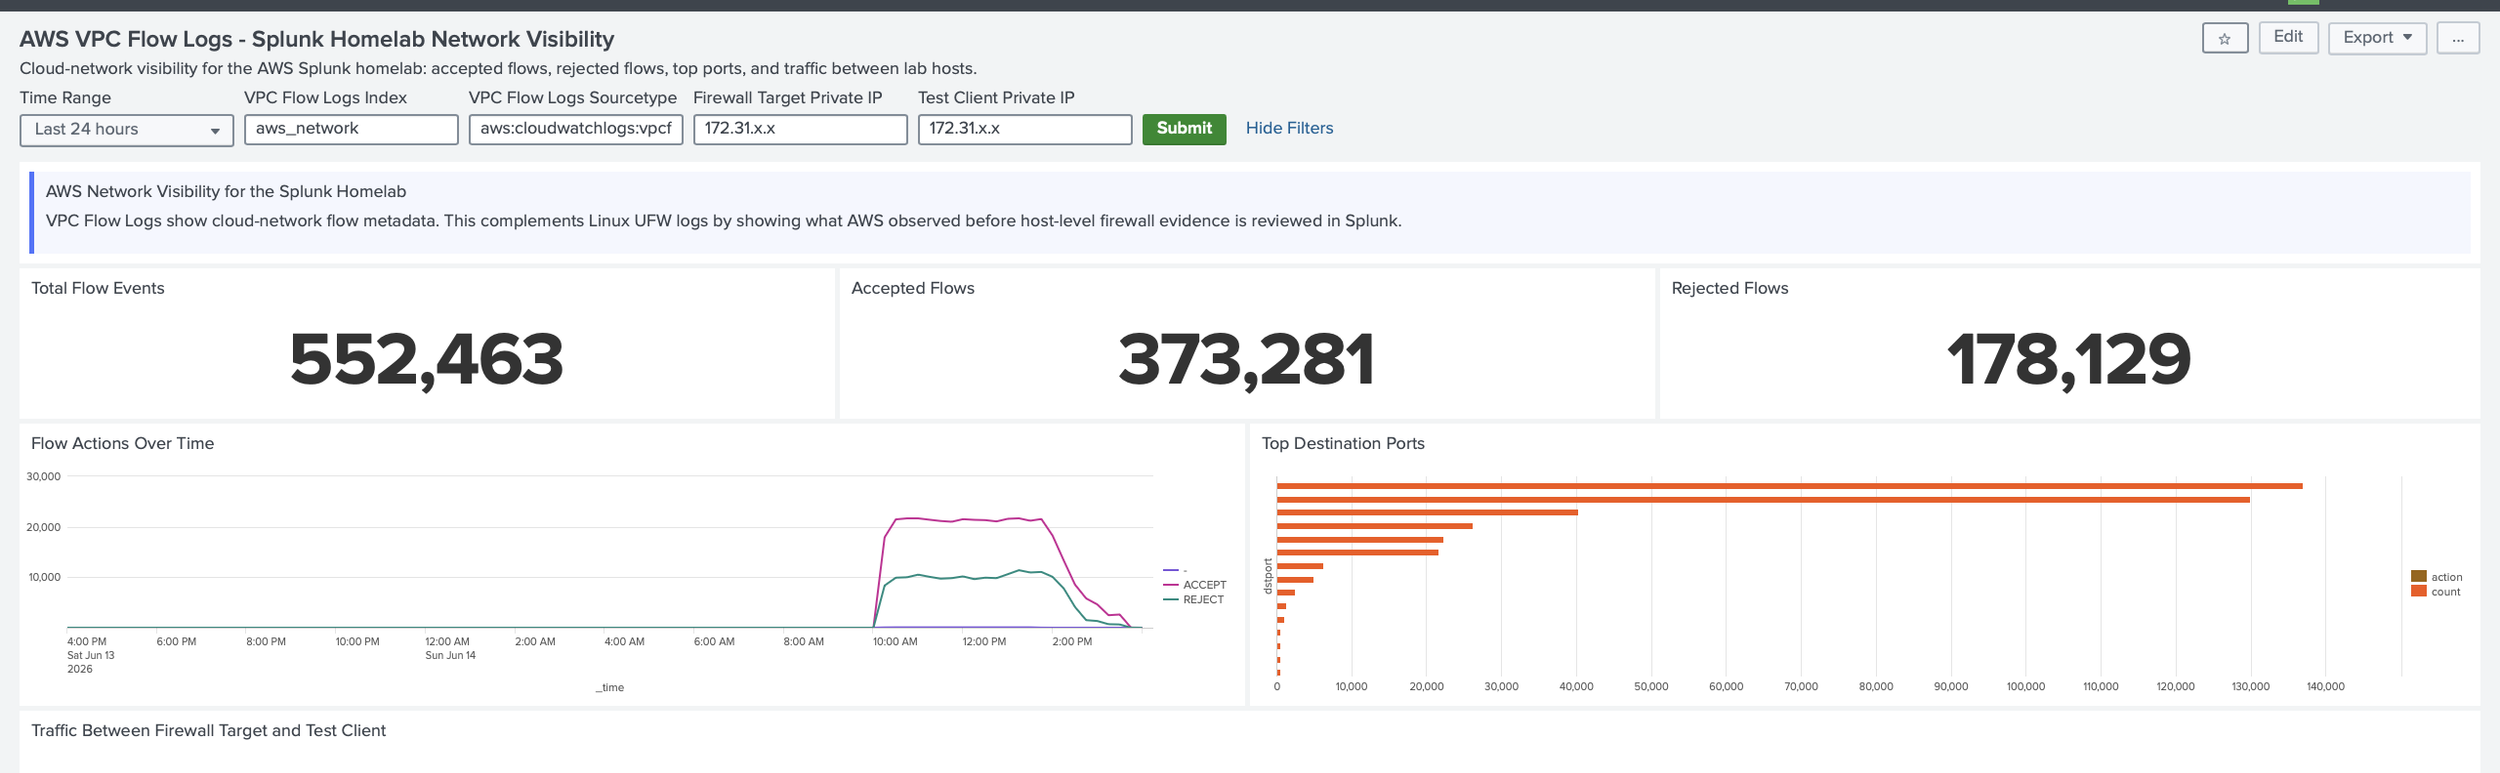
Figure 2: Example dashboard from the lab showing collected telemetry.
Looking back at the environment this way made it easier to see that several Security+ concepts were already present in work I had done for other reasons.
Preventive Controls: AWS and the Host
The most obvious preventive controls in the lab are network controls.
AWS Security Groups define which network paths can reach the EC2 instances. I also used UFW on an Ubuntu instance as a host-based firewall.
In one of my earlier networking exercises, I used two Ubuntu EC2 instances: a target host running NGINX and UFW, and a separate client that generated controlled test traffic.
I deliberately kept the AWS and host controls separate. The Security Group allowed the traffic necessary for the test, while UFW made the final decision for a test port at the operating system level. The test port was not opened broadly to the internet.
That setup gave me a useful way to revisit layered controls.
If the Security Group rejects a connection, the traffic does not reach the host. There is no reason to troubleshoot UFW first. If the AWS path is open but UFW rejects the connection, the problem has moved one layer closer to the server.
The distinction seems obvious once everything is working, but it matters during troubleshooting. Two controls may both affect network access while still operating at different layers and providing different evidence.
That is the part I want to retain from the Security+ material. I do not just want to remember that firewalls are preventive controls. I want to remember where a particular control is enforcing policy and what evidence should exist when it does.
Detective Controls: Following the Evidence
The same exercise also gave me something to review on the detective side.
Universal Forwarders collected logs from the Ubuntu systems into Splunk, including UFW and NGINX telemetry. From the test client, I could generate normal HTTP traffic and also attempt a connection to a port that the host firewall should reject.
The resulting evidence appeared at different layers.
A successful web request could be confirmed in the NGINX logs. Traffic rejected by the Linux firewall could be reviewed in the UFW logs. Splunk provided a common place to search the data and compare what happened.
That separation is useful because the sources are not interchangeable. An application log tells me that a request reached the application. A firewall log tells me what the firewall did with the traffic. Neither one provides the complete picture on its own.
I later added AWS VPC Flow Logs to the same environment, which provided another view.
The flow logs were sent to CloudWatch Logs and then ingested into Splunk using the Splunk Add-on for AWS on the Heavy Forwarder. I kept the data in a dedicated Splunk index so it was easy to separate from the Linux host data.
The VPC Flow Log dashboard focused on basic network questions: accepted and rejected flows, destination ports, traffic between the lab systems, and whether the source was still reporting.
This gave me three different perspectives on roughly the same path.
AWS could provide network-level flow metadata. UFW could show what happened at the Ubuntu firewall. NGINX could show what actually reached the web service.
Splunk did not replace any of those controls. It gave me a place to compare their evidence.
That is also a useful reminder when working with SIEM data. More telemetry does not automatically mean better visibility. Before adding another source, I should understand what question I expect it to answer.
There is also a less interesting but important part of detection: making sure the logging pipeline itself is working.
A dashboard with no blocked traffic might mean nothing was blocked. It could also mean the source stopped sending data.
For that reason, I included source and telemetry health in the lab rather than assuming that an empty search represented a quiet environment.
Corrective Controls and Troubleshooting
The corrective side of the lab is mostly manual.
If something is not behaving as expected, I work backward through the relevant layers, review the configuration or logs, make the necessary change, and test again.
That applies to the Splunk environment as much as it does to a firewall rule.
If events are missing, the problem could be at the source, the Universal Forwarder, the network path, the Splunk receiver, the input configuration, or the destination index. A working Splunk Web interface does not tell me that the entire collection path is healthy.
The corrective action itself may be simple—fix a configuration, restore connectivity, restart a service, or correct a rule—but I do not consider the process finished until I can verify that the expected data or behavior has returned.
I have not tried to automate all of that in this lab. At this stage, manual troubleshooting is useful because it forces me to understand where the failure occurred.
In a production environment, automation could make sense for well-understood failure cases, but I would want reliable detections, clear ownership, and a rollback path before allowing a remediation process to make infrastructure changes automatically.
How I Think About the Control Flow
The three Security+ categories make more sense to me as parts of the same process than as separate definitions.
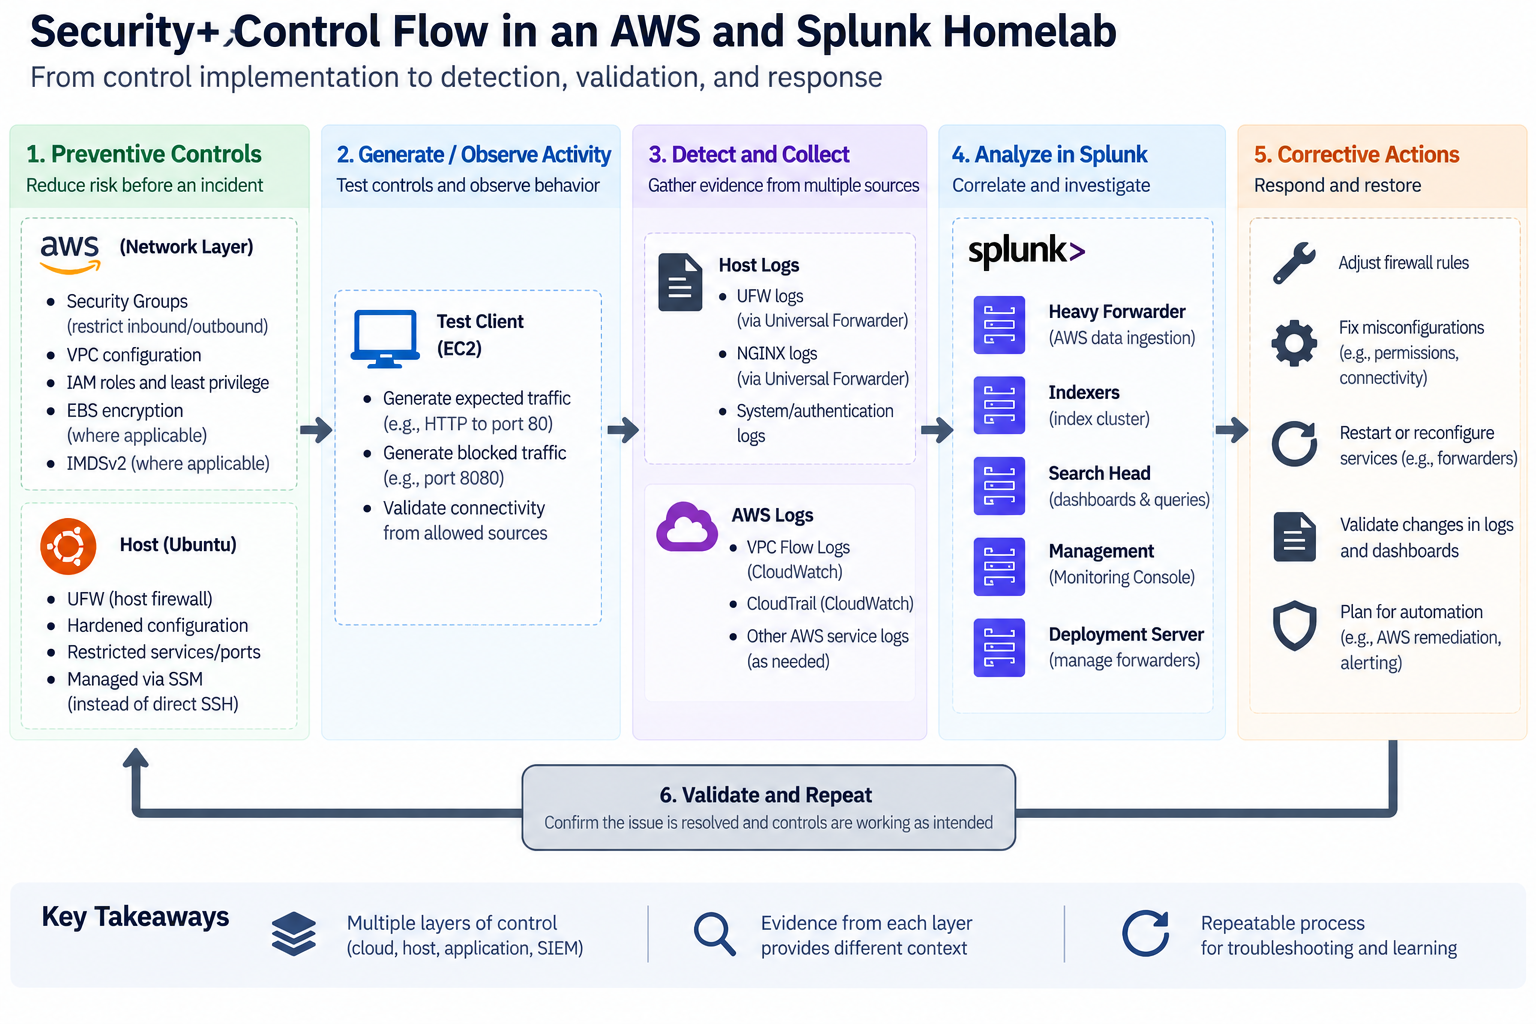
A preventive control establishes the intended boundary. I generate or observe activity against that boundary. Detective controls provide evidence of what happened. If the observed result does not match the intended state, I investigate, correct the issue, and test again.
In short:
Prevent → Test → Detect → Compare → Correct → Retest
That is the part I find useful to carry forward.
The value is not simply in being able to label a Security Group as preventive or Splunk logging as detective. The value is in understanding how the controls relate to one another when I am building or troubleshooting an actual system.
What I Would Do Differently in Production
This environment was built for learning, so there are several areas I would handle differently in production.
I configured a significant portion of the lab manually because I wanted to understand the individual components. For a production deployment, I would move repeatable cloud configuration toward infrastructure as code and formal change review.
Administrative access would also need stronger centralized controls. I would expect defined administrative paths, centralized identity, appropriate role separation, and tighter management of privileged access.
The Splunk side would require more formal planning around capacity, availability, certificate management, backups, access controls, and recovery. I would also put more emphasis on monitoring the collection infrastructure itself so that failures in the logging pipeline were surfaced quickly.
I would take the same approach with additional AWS telemetry. I would add sources based on specific detection requirements rather than enabling every available service simply because it produces security data.
The same applies to automated remediation. Automation can be valuable, but I would want the underlying detection to be reliable and the rollback path to be clear before allowing it to make infrastructure changes automatically.
The homelab gives me room to understand individual pieces. Production adds scale, availability requirements, operational ownership, and consequences when changes go wrong.
Why I Went Back to Security+
The main purpose of this exercise was not to build another project. I already had the project.
I wanted a better way to review material I learned several years ago and make sure the underlying concepts were still useful to me.
Going back through an existing environment turned out to be a good way to do that. Instead of reviewing preventive, detective, and corrective controls as isolated terms, I could look at systems I had already worked with and ask practical questions.
What is enforcing the policy here?
What evidence should this control produce?
Which layer would I troubleshoot first?
How would I know that a change actually fixed the problem?
Those are questions I am more likely to remember than a definition from a study guide.
I plan to use some of my other labs the same way as I revisit older material. It is a relatively low-overhead way to keep foundational knowledge current while also making sure I can still explain the technical decisions behind work I have already done.
For this review, the point I want to keep is simple:
Know what a control is supposed to do, where it operates, and what evidence would show that it worked.