From Threat Intel to Splunk Evidence: Validating Dirty Frag in an AWS Homelab
Problem
I listen to the SANS Internet Storm Center StormCast as part of my daily security routine because the episodes are short, current, and packed with practical information. When the Monday, May 11, 2026, episode covered Dirty Frag, I did not want to treat it as just another headline to read and put behind me. I wanted to turn that knowledge into something I could safely validate inside the AWS-based distributed Splunk environment I had already built.
That became the purpose of this project. Instead of downloading exploit code or trying to reproduce privilege escalation, I wanted to approach Dirty Frag from a defender’s perspective: which Ubuntu hosts are in scope, which kernel components matter, what telemetry is needed, what mitigation would change, and whether Splunk could prove the before-and-after state.
Skills demonstrated: Splunk Enterprise architecture, AWS EC2 security design, Ubuntu administration, Universal Forwarder deployment, Deployment Server management, indexer cluster data onboarding, Linux audit and package telemetry, Dirty Frag CVE mapping, module-state validation, mitigation evidence collection, dashboard-driven defensive review, and security operations documentation.
Dirty Frag refers to two Linux kernel local privilege escalation vulnerabilities: CVE-2026-43284 and CVE-2026-43500. CVE-2026-43284 involves ESP/IPsec-related kernel paths, including esp4 and esp6. CVE-2026-43500 involves the RxRPC path, including rxrpc. In practical terms, the risk is post-compromise expansion: a local user, process, container workload, or compromised service may be able to move from limited access to root-level access on a vulnerable host.
I used my existing Splunk AWS homelab as the foundation. The goal was to take Dirty Frag and turn it into a safe defensive validation workflow: identify the risk, define the terms, collect evidence, make a controlled change, and validate the result.
What Dirty Frag Means
Dirty Frag is shorthand for Linux kernel local privilege escalation risk involving networking and page-cache behavior. A local privilege escalation vulnerability is different from an initial access vulnerability: the attacker already needs some way to run code on the host, such as compromised SSH access, a low-privileged service account, a web shell, container workload abuse, or another foothold.
One Dirty Frag path involves ESP/IPsec-related components. ESP stands for Encapsulating Security Payload, a protocol used by IPsec to provide confidentiality, integrity, and authentication for network traffic. IPsec is often associated with VPNs and encrypted network tunnels. In Linux, esp4 supports ESP handling for IPv4 traffic, while esp6 supports ESP handling for IPv6 traffic. The related xfrm framework is the Linux kernel framework that performs packet transformations for IPsec and related networking functions.
The other Dirty Frag path involves RxRPC. RxRPC is a remote procedure call protocol implemented in the Linux kernel. It is commonly discussed with AFS, which stands for Andrew File System. AFS is a distributed file system, and Linux AFS-related functionality can depend on RxRPC. That is why a mitigation that blocks rxrpc should be checked carefully before applying it to systems that may use AFS or RxRPC-dependent workloads.
The memory concept behind the risk is the page cache. The page cache is memory Linux uses to keep file contents available for faster reads. Dirty Frag matters because vulnerable kernel paths can allow page-cache-backed data that should be treated as read-only to be modified in memory. That type of behavior can help an attacker influence protected files or binaries and move from local code execution to root-level privileges.
A socket buffer, often shortened to skb, is a Linux kernel networking data structure used to hold packet data. A frag is a fragment reference inside networking buffers. Zero-copy is a performance approach that tries to avoid unnecessary copying between memory areas. Splice is a Linux system call used to move data between file descriptors efficiently. These concepts matter because the vulnerability class involves optimized kernel data paths, memory references, and page-cache-backed data, not a normal application-layer bug.
For this blog, I treated the two Dirty Frag CVEs as the project scope. Microsoft later noted a related variant named Fragnesia, CVE-2026-46300, in a May 14 update. I kept the hands-on lab focused on Dirty Frag, but I designed dashboards in a way that future CVE-to-module mappings can be added without rebuilding the whole workflow.
Lab Setup
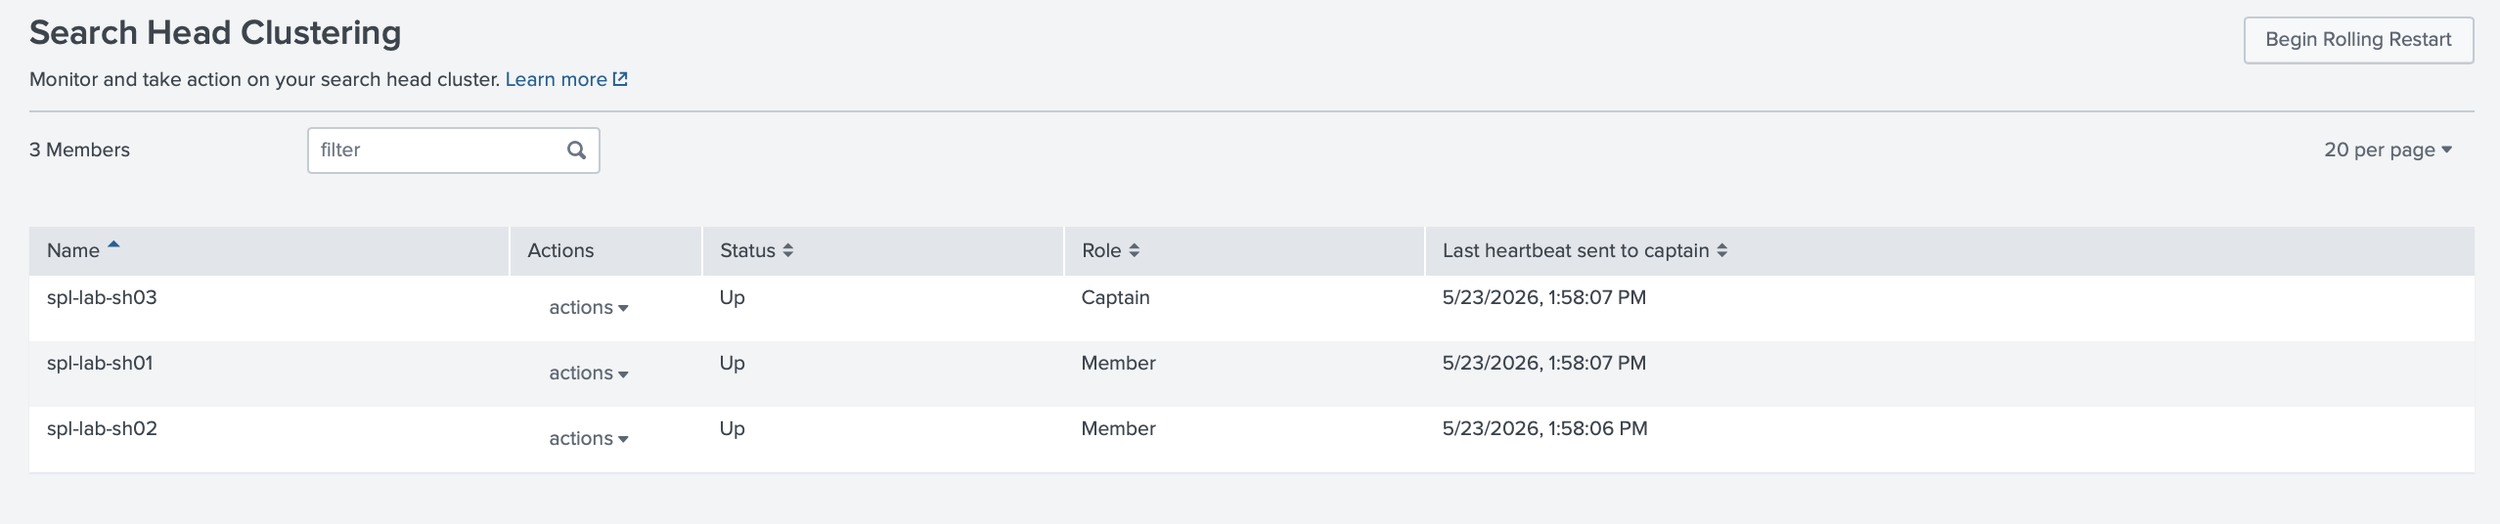
The project used my existing distributed Splunk Enterprise homelab in AWS. That environment included a Cluster Manager, three indexers, three search heads, a Deployer, a Deployment Server, a Management Server running the License Manager and Monitoring Console, a Universal Forwarder, and an intermediate forwarding tier using a Heavy Forwarder.
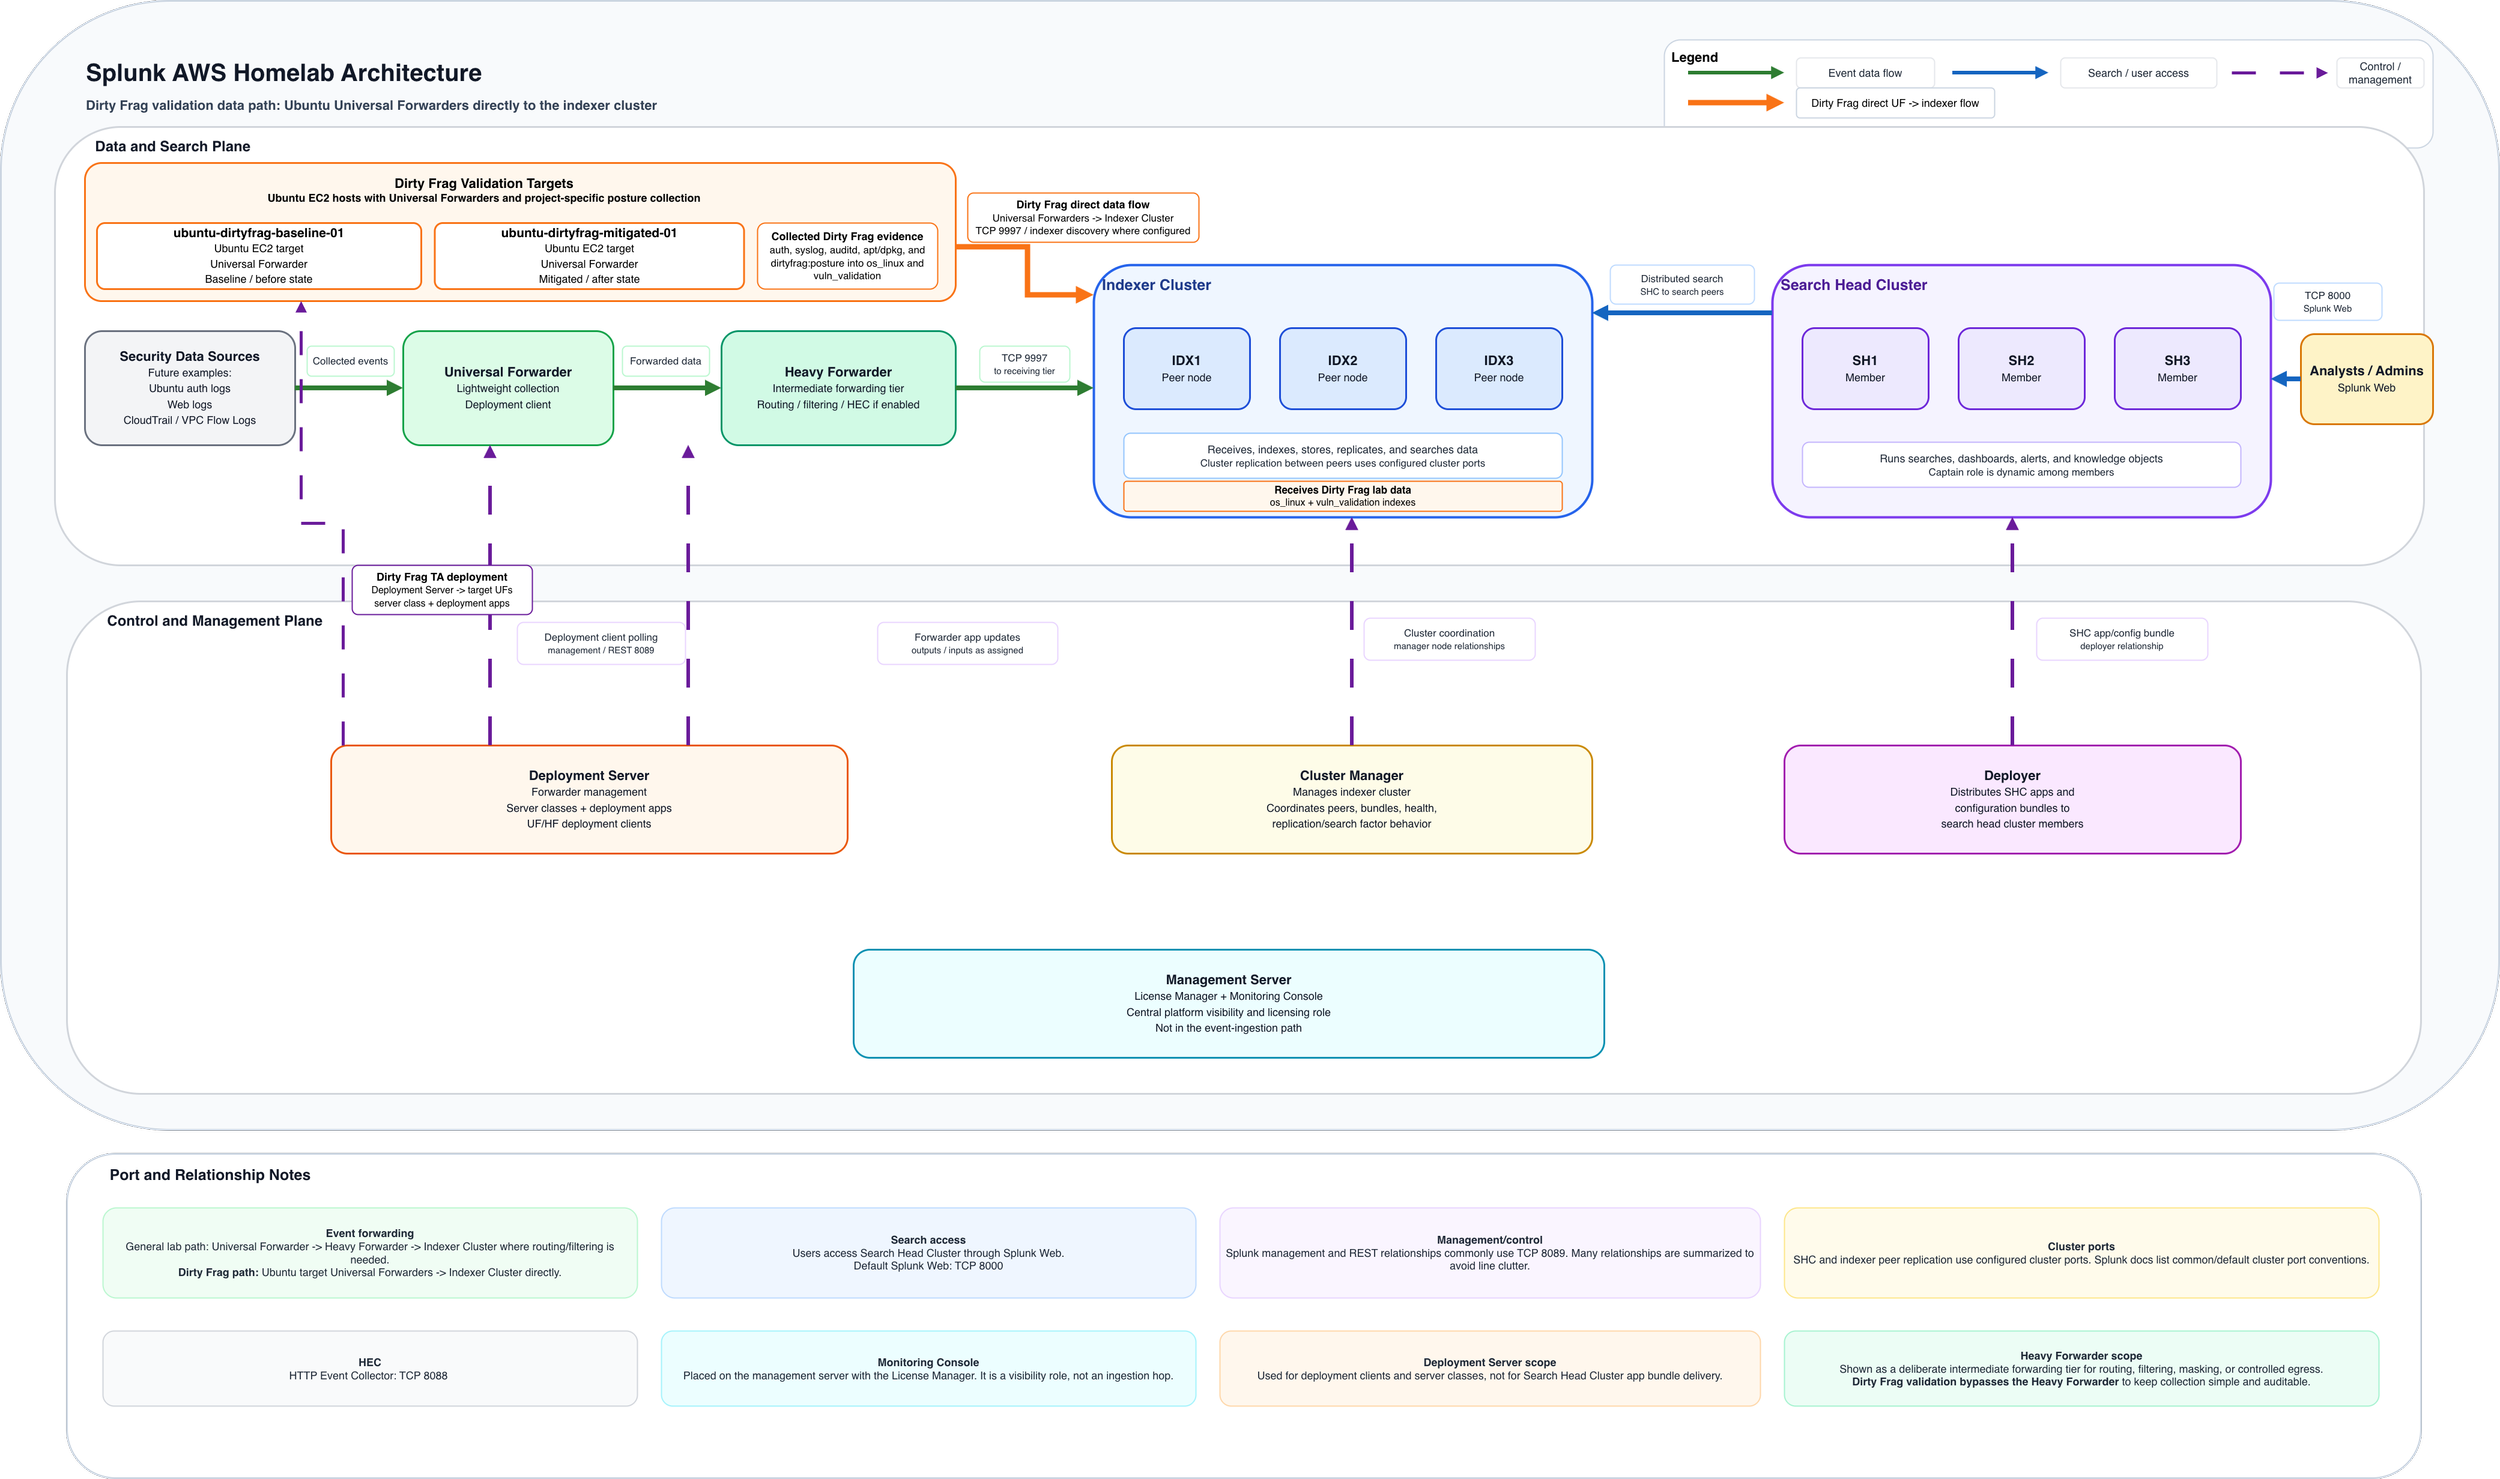
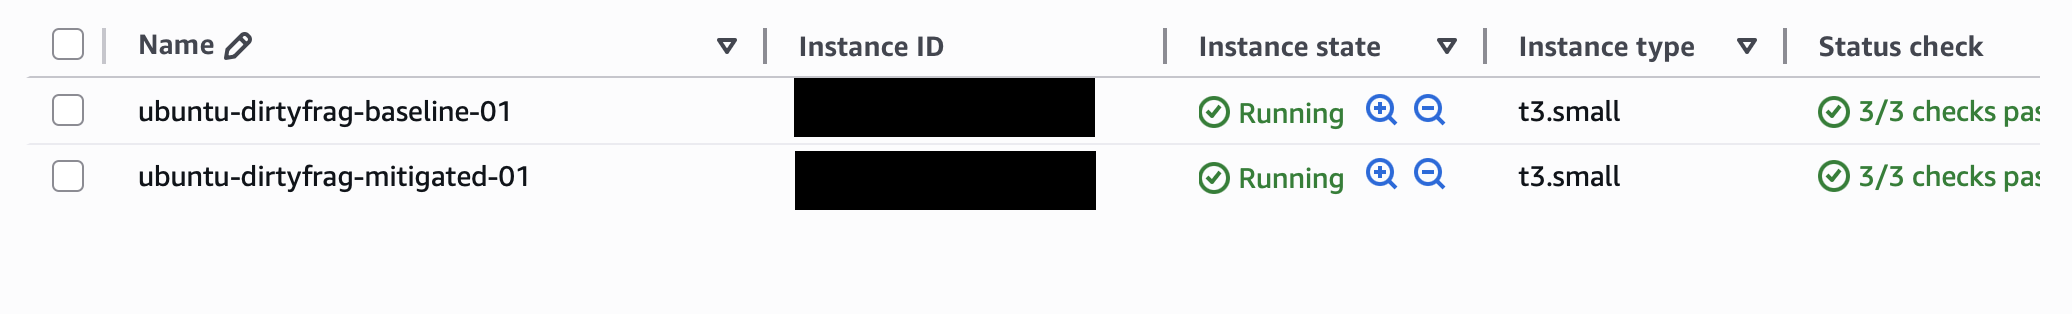
For this workflow, I kept the Dirty Frag data path simple. I added two Ubuntu EC2 target hosts, utilizing each with a Splunk Universal Forwarder agent to send logs directly to the indexer cluster. I did not use a Heavy Forwarder because this project did not require intermediate routing, filtering, masking, or controlled egress. Keeping the path simple made validation easier.
One host represented the baseline state, and one host represented the mitigated state. That gave me a clean before-and-after comparison without changing the rest of the Splunk infrastructure. I kept AWS security groups scoped, used EBS encryption, and treated the new hosts as part of the same disciplined lab design rather than as throwaway test systems.
Add-ons, Apps, and Telemetry
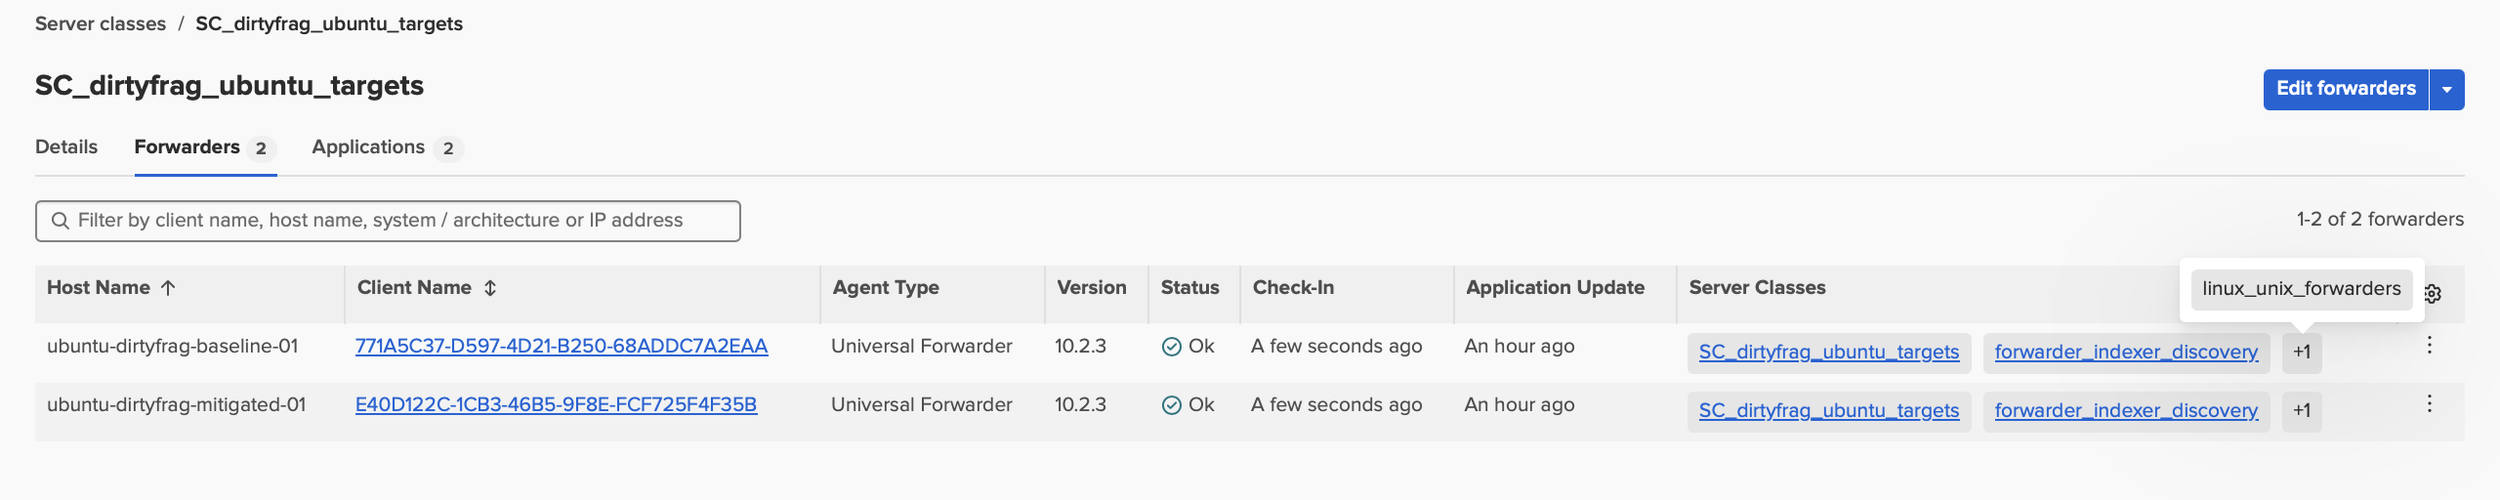
I separated collection, parsing, and presentation on purpose. On the Ubuntu target hosts, the Universal Forwarder handled lightweight collection. The Deployment Server controlled which logging and posture apps were sent to those hosts. The search head cluster handled searches and dashboards through the Deployer.

For standard Linux collection, the Splunk Add-on for Unix and Linux is the logical starting point. It can collect data from Unix and Linux hosts and can be installed on a forwarder to send data to a Splunk Enterprise indexer or group of indexers. I still would not enable every input blindly. For this project, the useful data was focused: authentication logs, system logs, audit logs, package logs, dpkg logs, and a small Dirty Frag posture script.
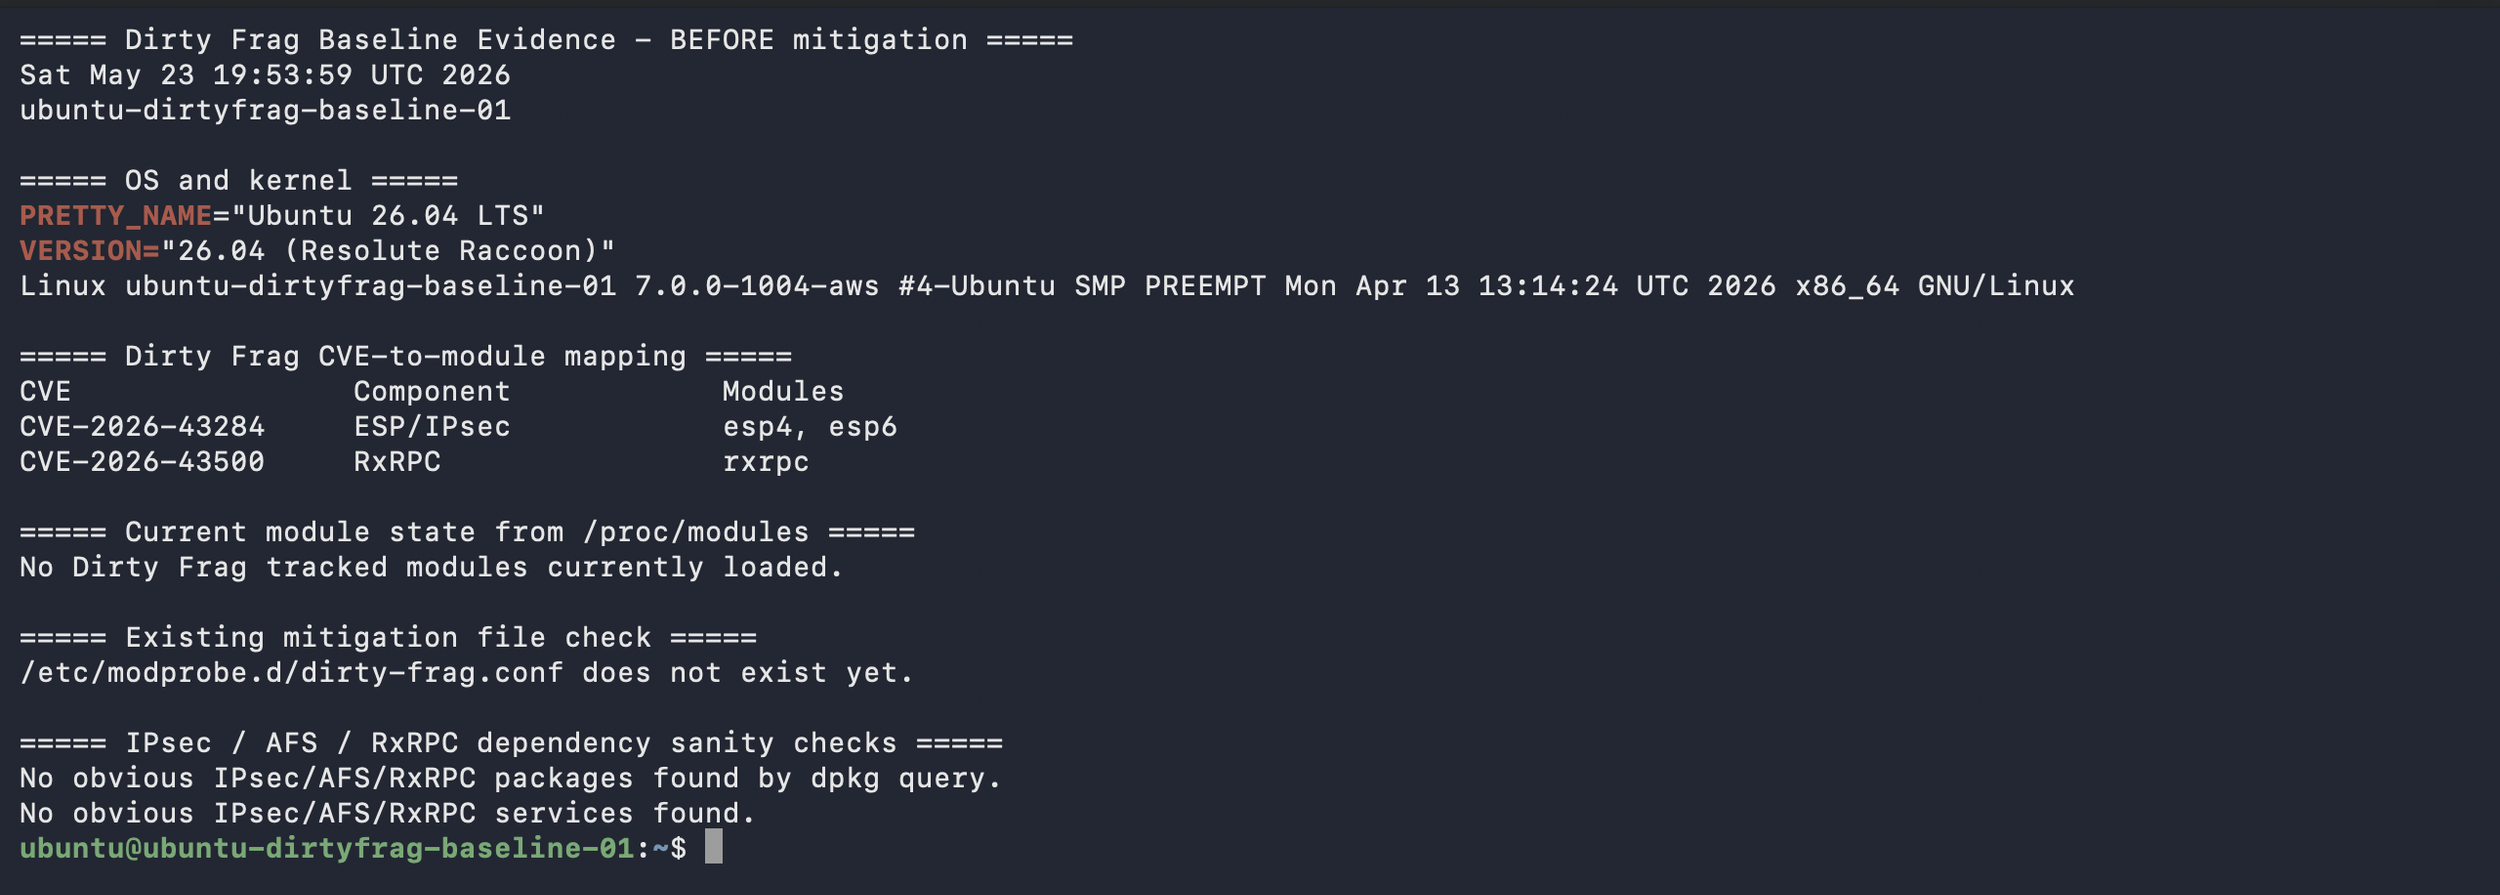
The Dirty Frag posture script kept project-specific logic separate from general Linux logging. The script reported host state, not exploit behavior: Ubuntu version, kernel version, loaded esp4, esp6, and rxrpc modules, mitigation file status, and whether the expected module-blocking lines were present.
What I Built
I built the project around a simple defensive workflow: read the SANS diary item and guidance from reputable sources, such as Ubuntu and Microsoft, map the CVEs, define the affected components, collect host telemetry, validate exposure, apply mitigation carefully, and prove the change in Splunk.
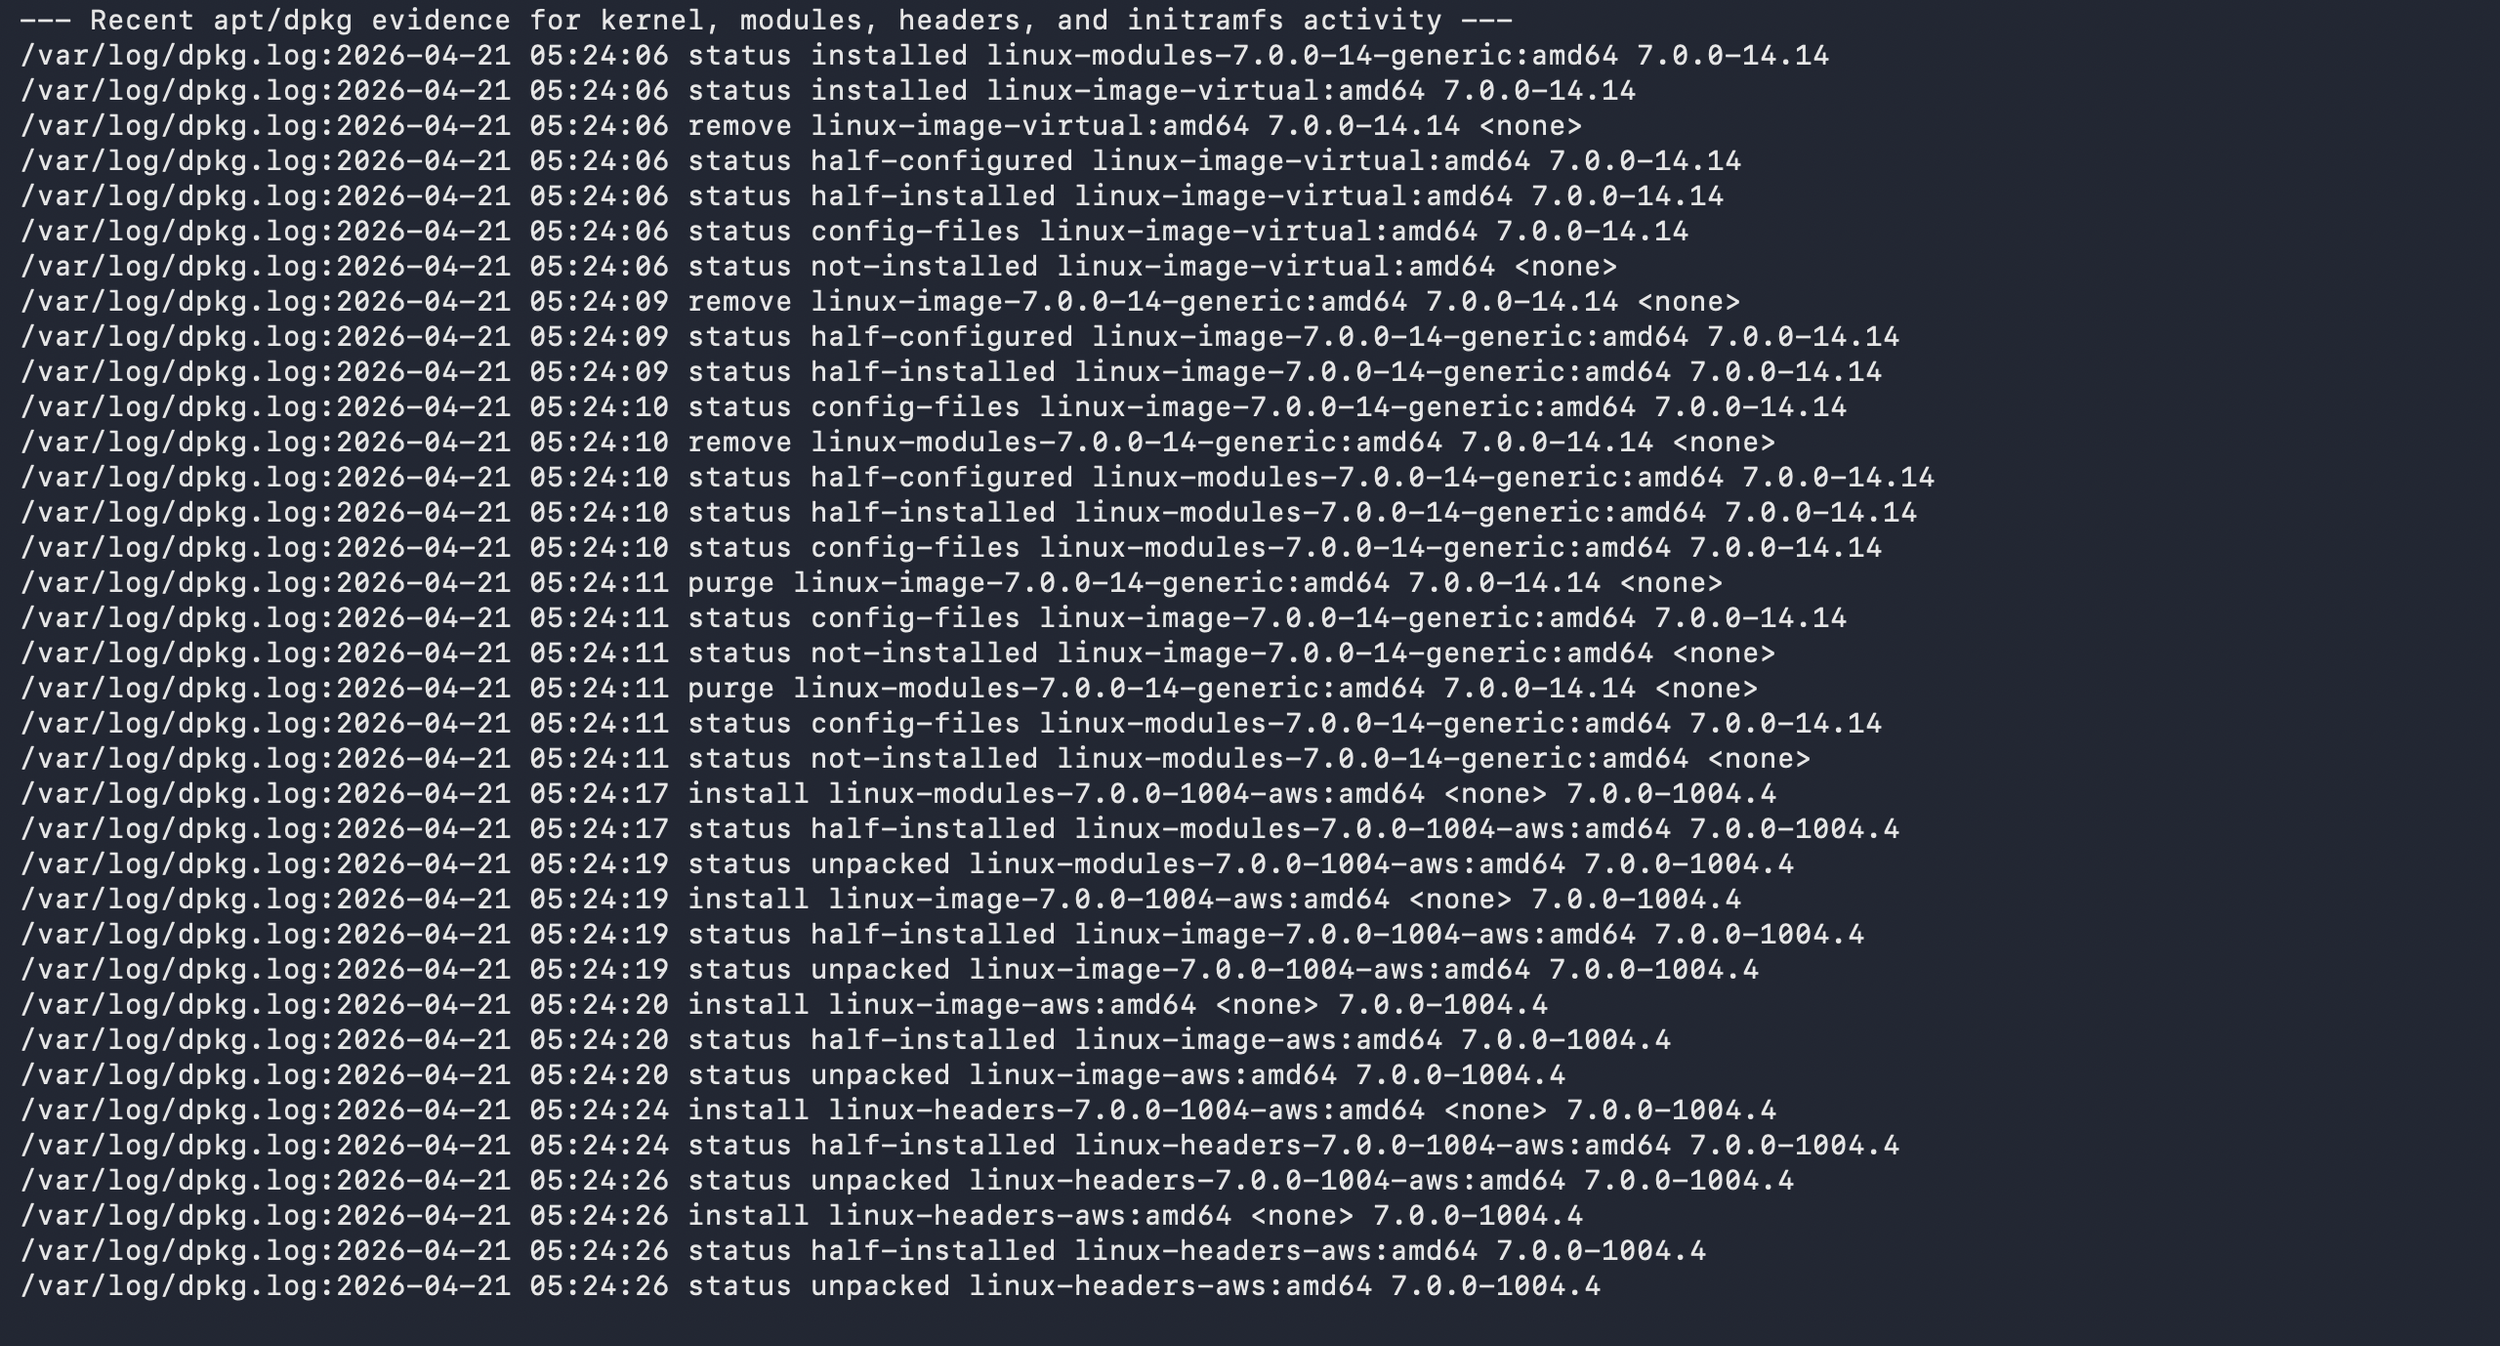
The first layer was Ubuntu telemetry. I onboarded authentication logs, system logs, audit logs, package logs, and scripted posture data. Authentication logs helped show SSH, sudo, su, and session activity. Audit logs helped track sensitive file and command activity. Package logs showed kernel, module, and initramfs-related changes. The posture script reported kernel version, loaded modules, and mitigation state.
The second layer was exposure validation. I focused on whether esp4, esp6, or rxrpc were loaded and whether /etc/modprobe.d/dirty-frag.conf existed. I also checked whether those modules were needed. That step mattered because blocking ESP/IPsec modules can affect IPsec use cases, and blocking rxrpc can affect AFS or RxRPC-related functionality.
The third layer was Splunk evidence. I created searches and dashboard panels to show module state, CVE mapping, mitigation file presence, package activity, auditd evidence, authentication activity, and missing telemetry. The purpose of this layer was to prove the process: what was true before the change, what changed, and what was true afterward.
Security and Implementation Notes
I treated this as a safe defensive validation project. I did not run exploit code, stage malicious binaries, or try to gain root through the vulnerability. That boundary matters because the goal of the lab is to practice judgment, not just curiosity.
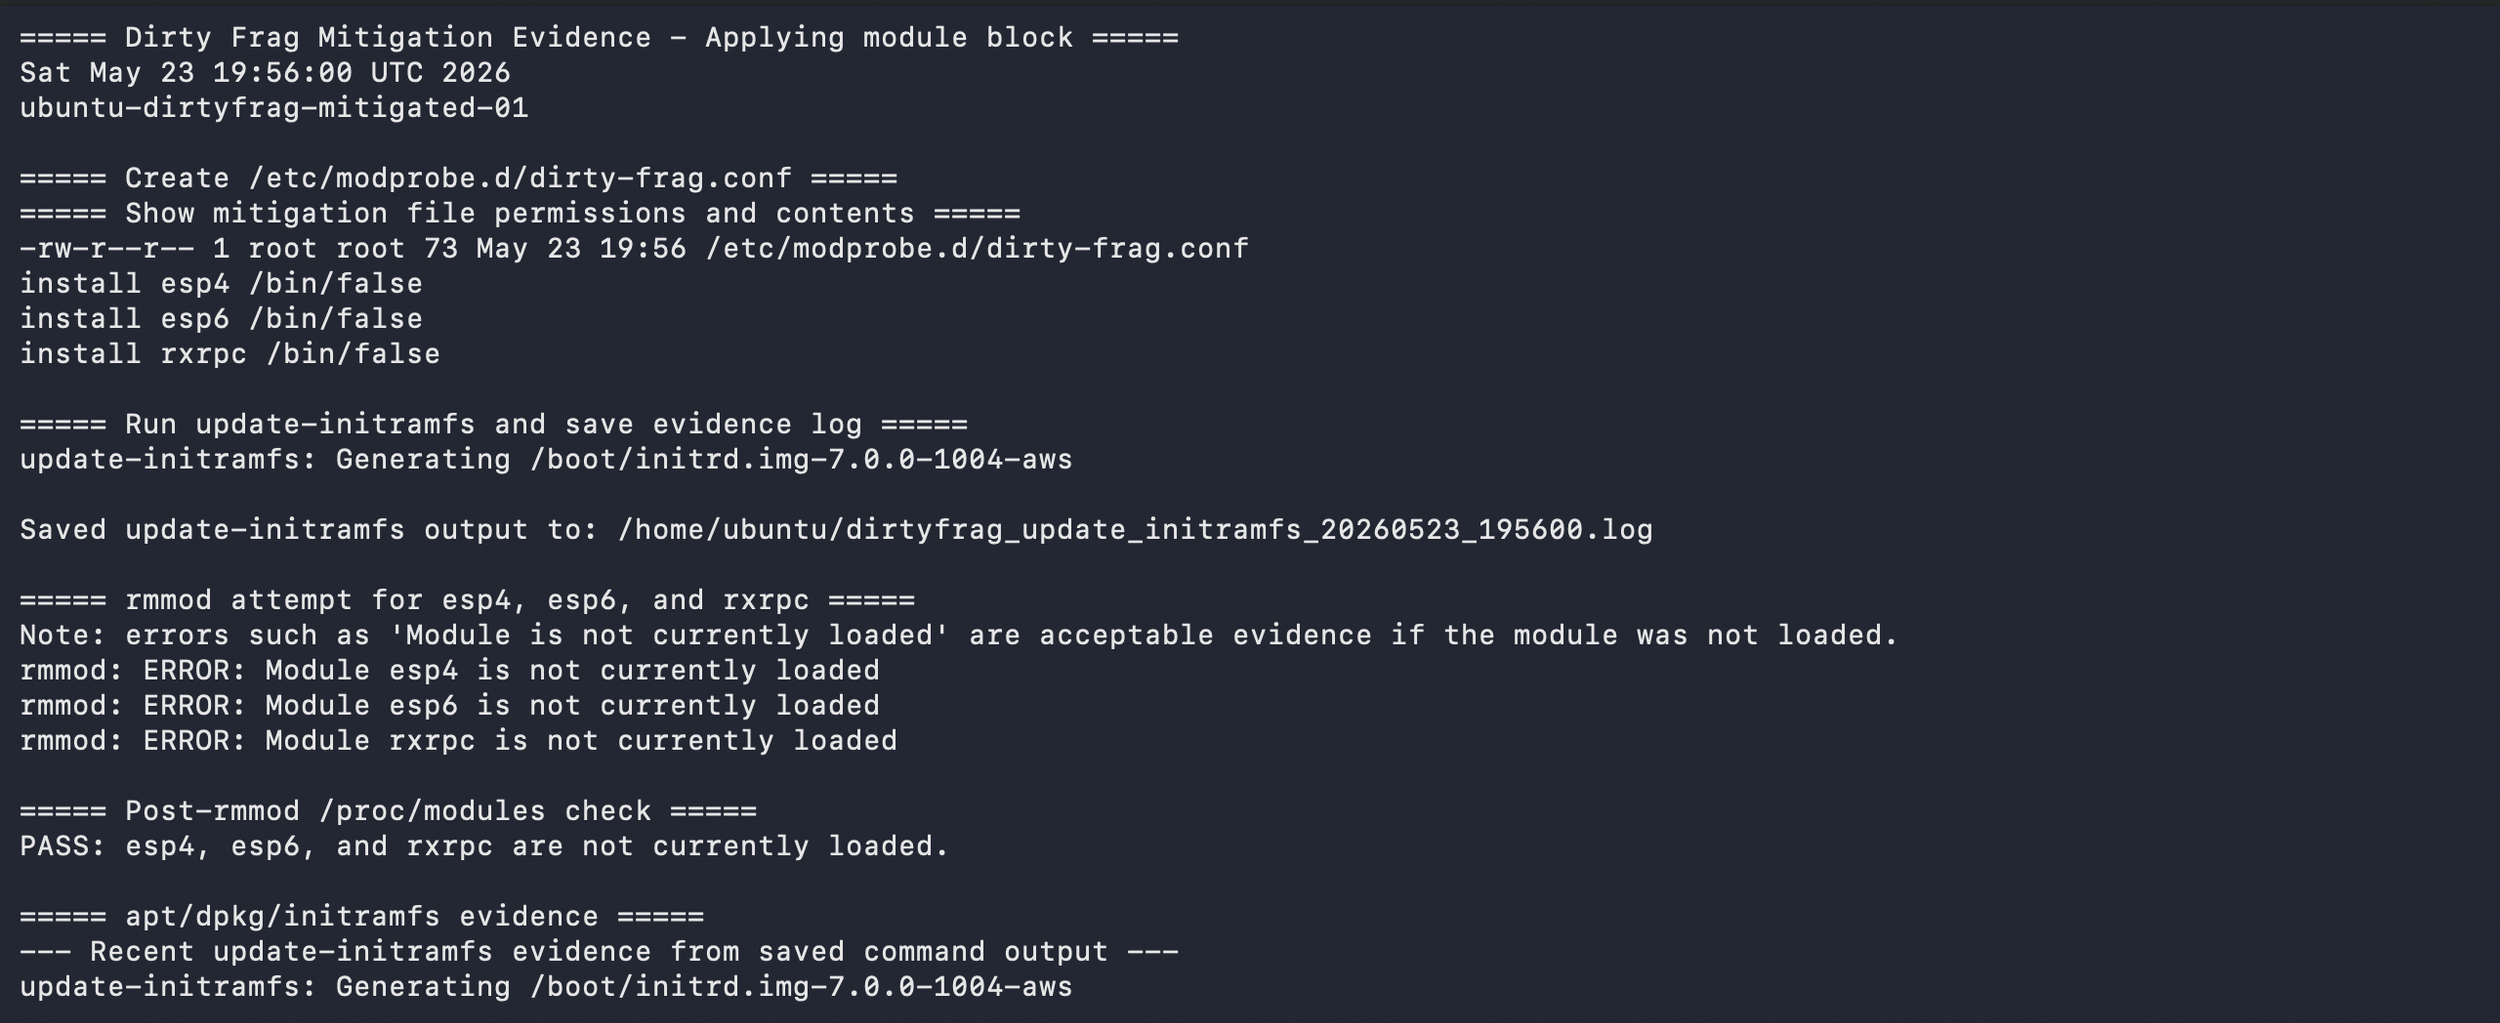
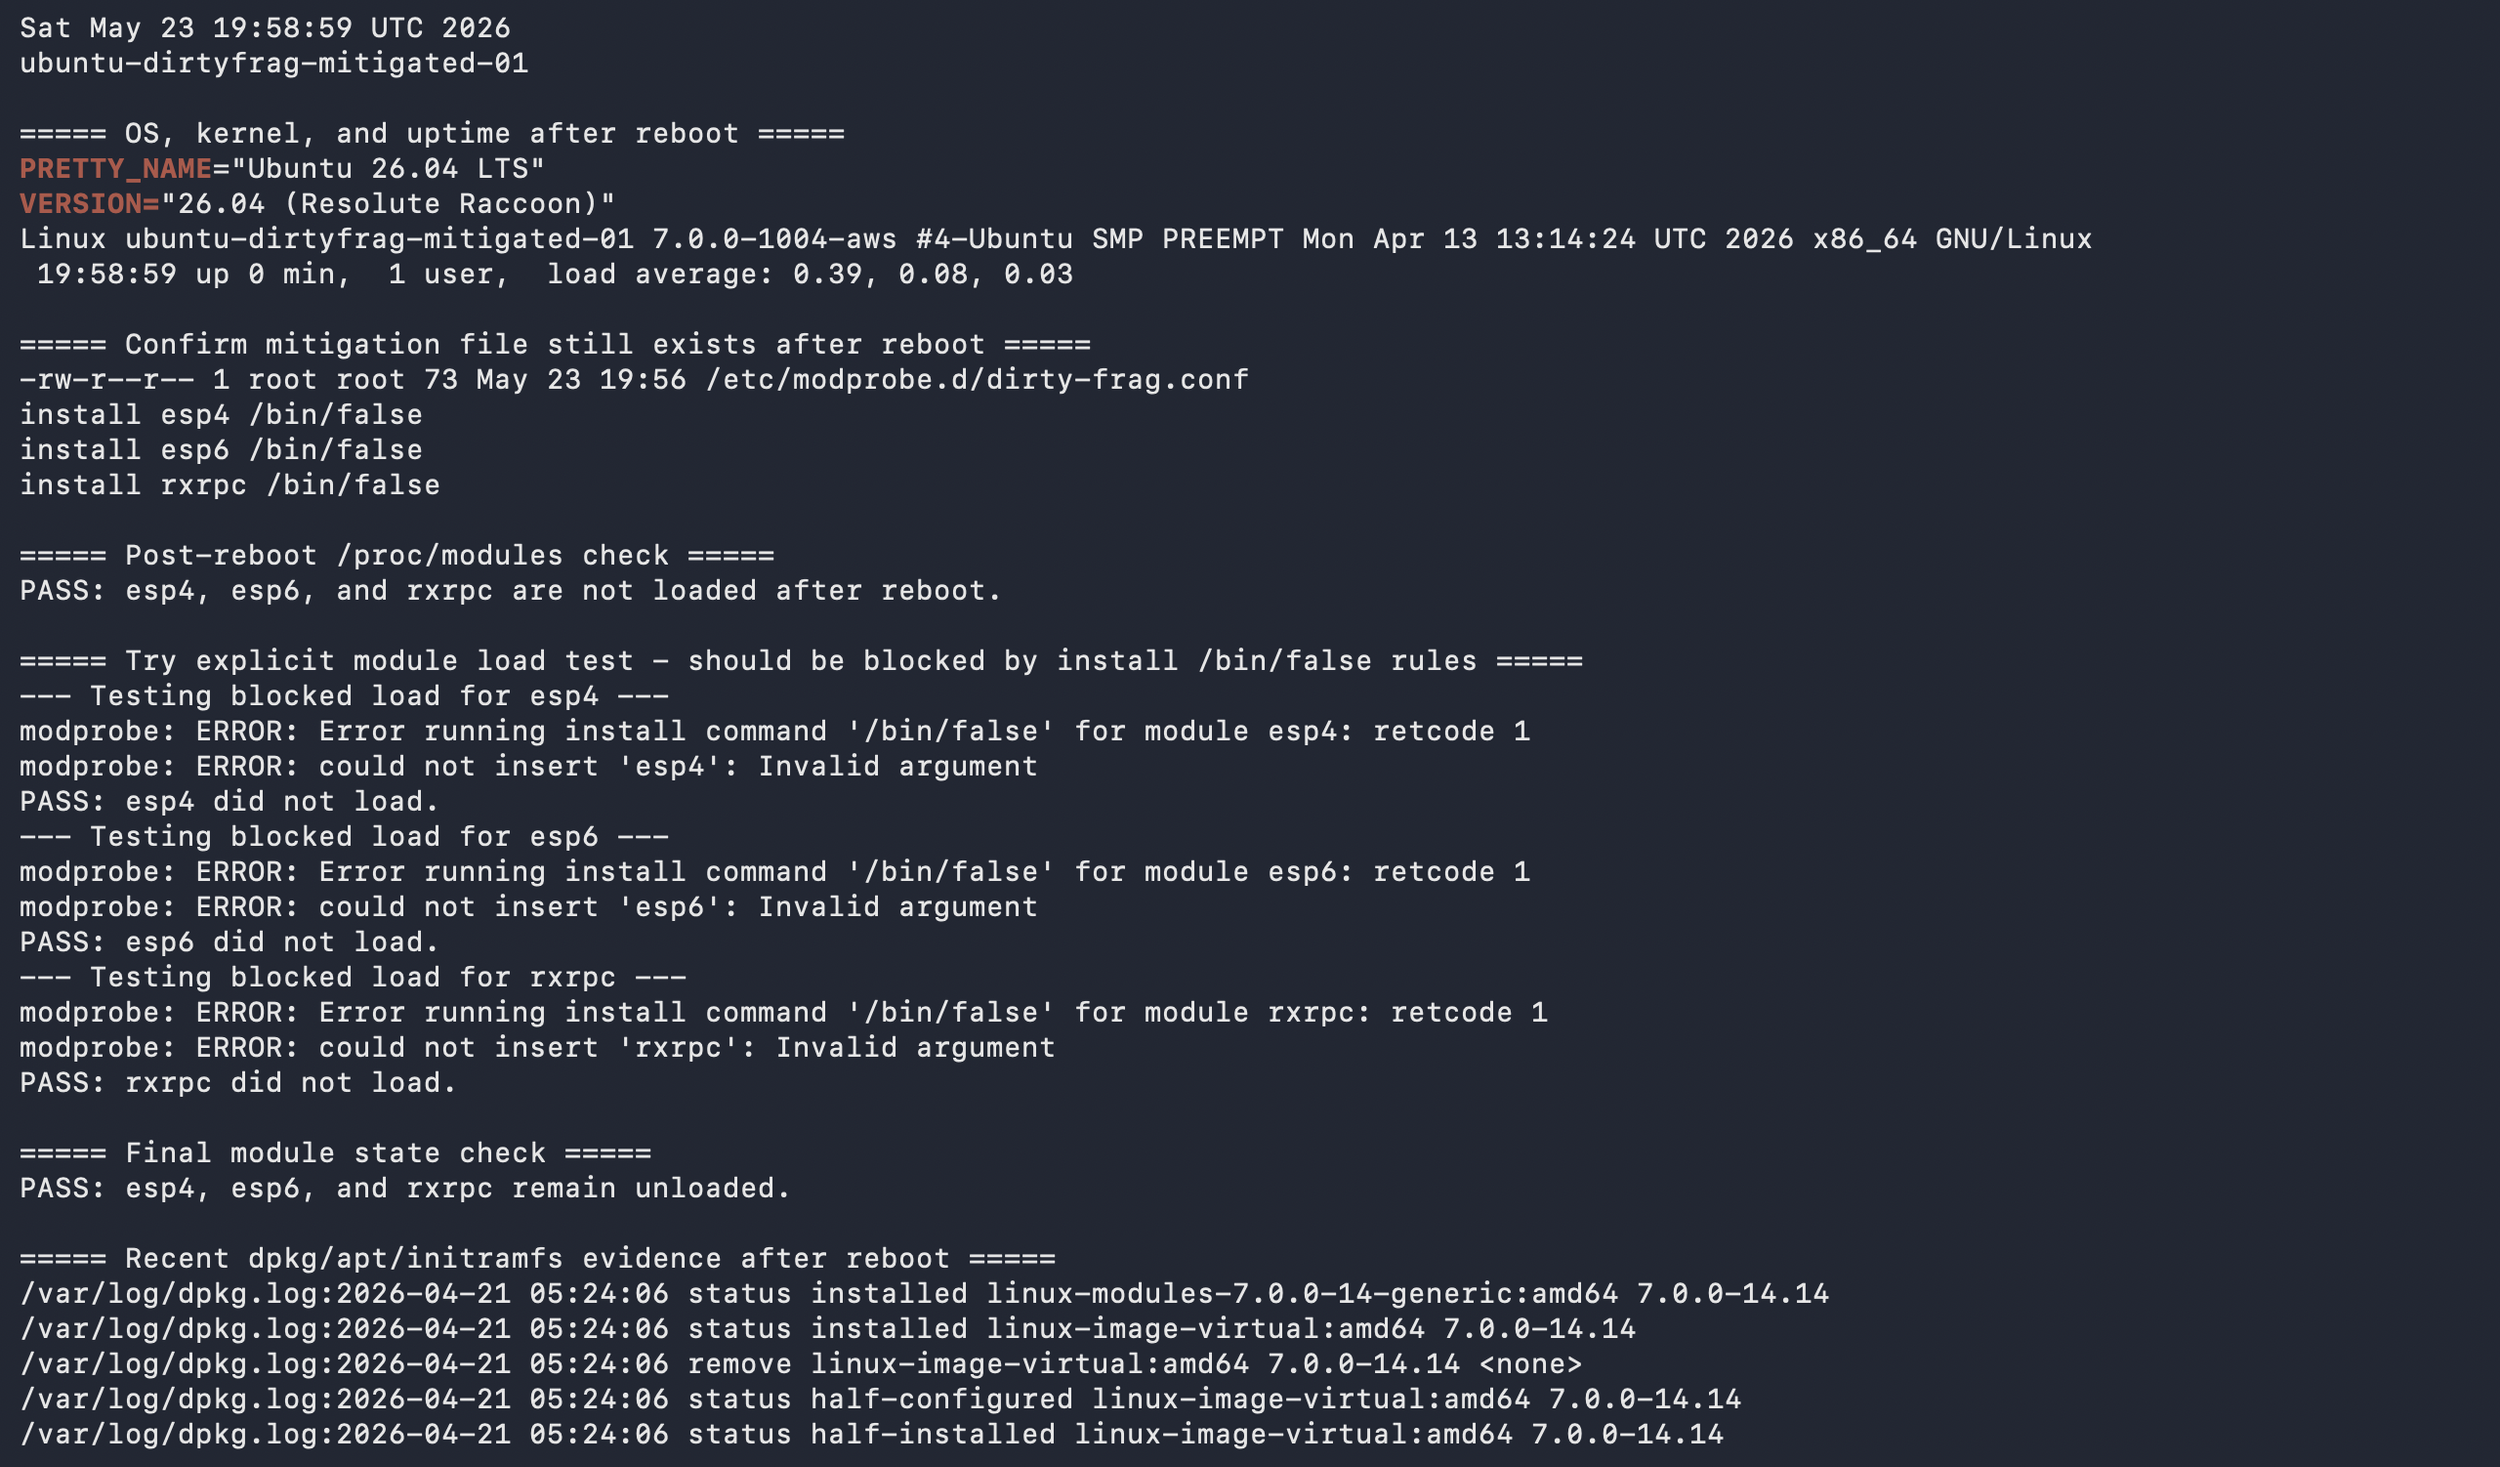
The mitigation work followed vendor guidance. On Ubuntu, the documented interim mitigation blocks the affected modules from loading, regenerates initramfs so the block persists into early boot, unloads the modules if possible, and checks whether a reboot is needed. I treated that as a change-control exercise, not a copy-and-paste task. Before applying it, I documented whether the Ubuntu hosts used IPsec, VPN, AFS, or RxRPC-related services. After applying the mitigation, I validated whether the modules were still loaded and whether the module-blocking configuration persisted after reboot.
I also watched for surrounding behaviors that matter in a real intrusion chain. Local privilege escalation usually happens after some earlier access exists. That made authentication logs, sudo activity, su activity, auditd records, package changes, and missing-data checks part of the project. A kernel vulnerability is not only a kernel problem. It is also an access, telemetry, response, and validation problem.
The most useful part was forcing the lab to answer practical questions. Which hosts are in scope? Which data sources prove exposure? Which search shows the before state? Which search shows the after state? If a log source stopped forwarding, would I notice? If I could not answer those questions, the lab was not finished.
Dashboard Approach
The dashboards were how I showcased Dirty Frag safely: they translated a Linux kernel local privilege escalation issue into observable conditions instead of exploit steps.
The technical dashboard was built for security analysts and Linux administrators, while the executive dashboard translated the same evidence into scope, mitigation progress, review status, and telemetry health.
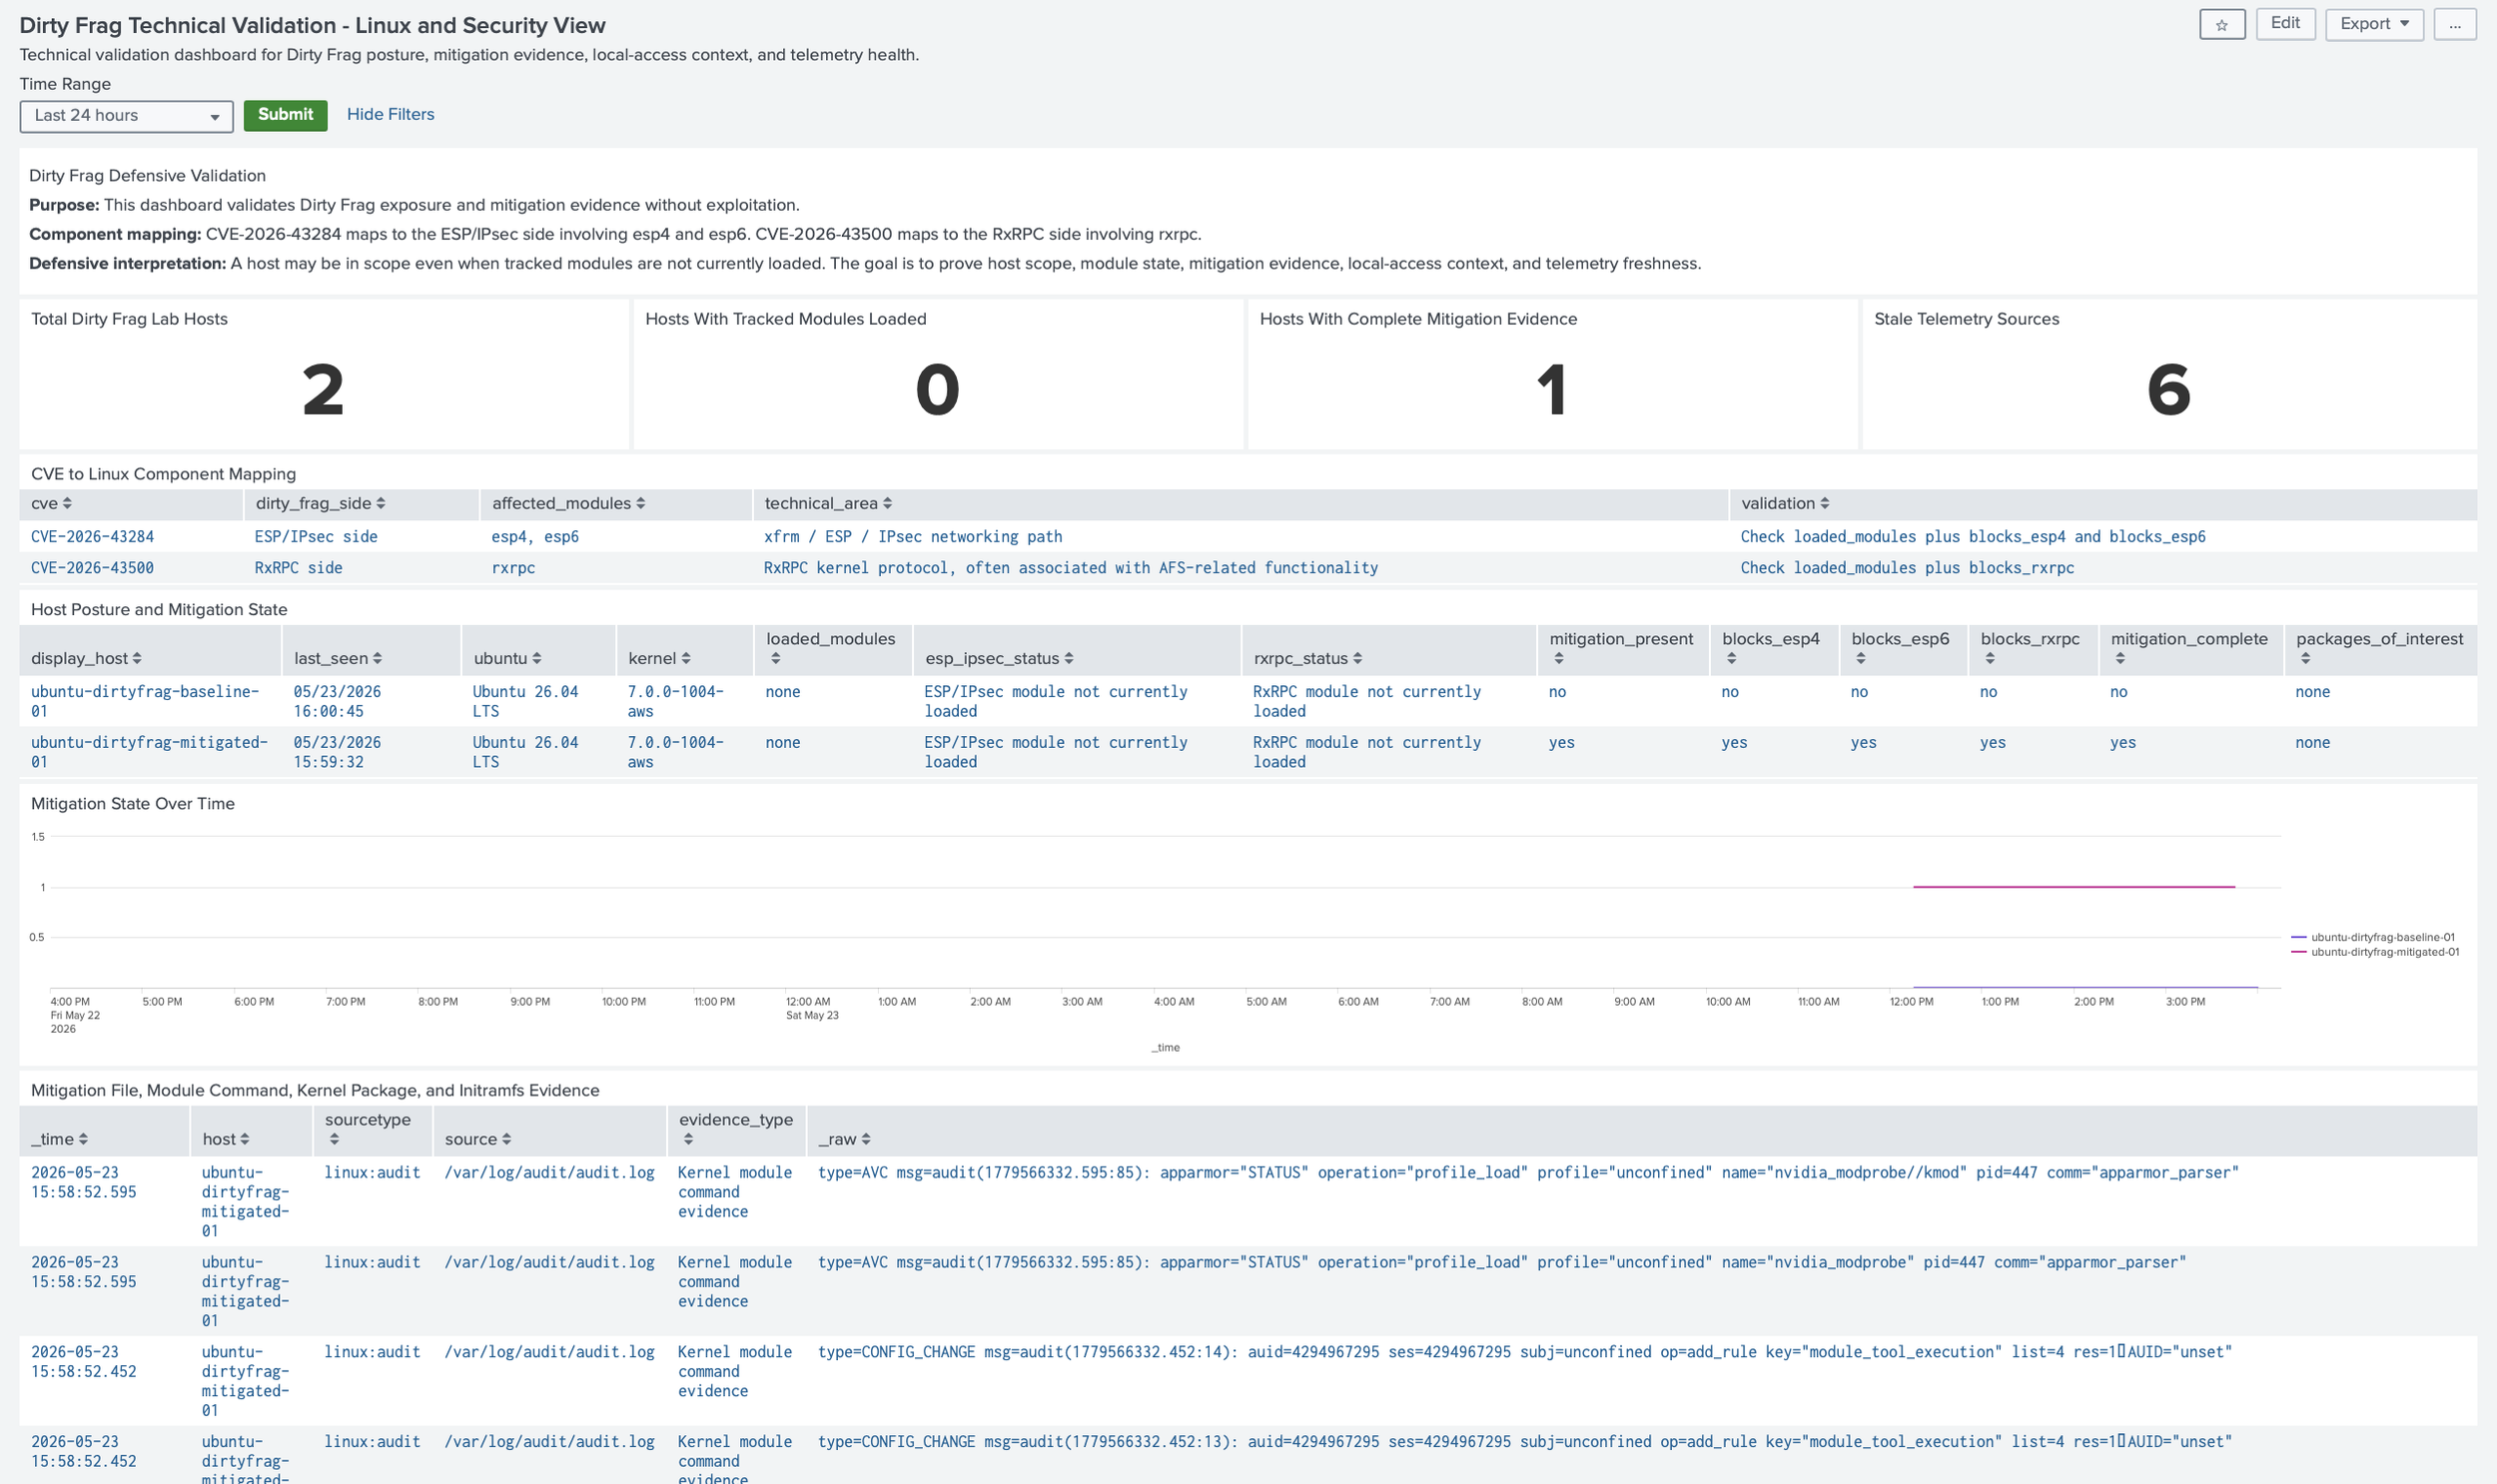
Instead of showing exploitation, the technical view showed affected CVEs, affected kernel components, host scope, kernel version, module state, mitigation evidence, package and initramfs activity, audit evidence, authentication context, and telemetry freshness.
The first technical panel mapped CVE-2026-43284 to the ESP/IPsec side involving esp4 and esp6, and CVE-2026-43500 to the RxRPC side involving rxrpc. That connected vulnerability names to the actual Linux components my posture script and Splunk searches were checking.
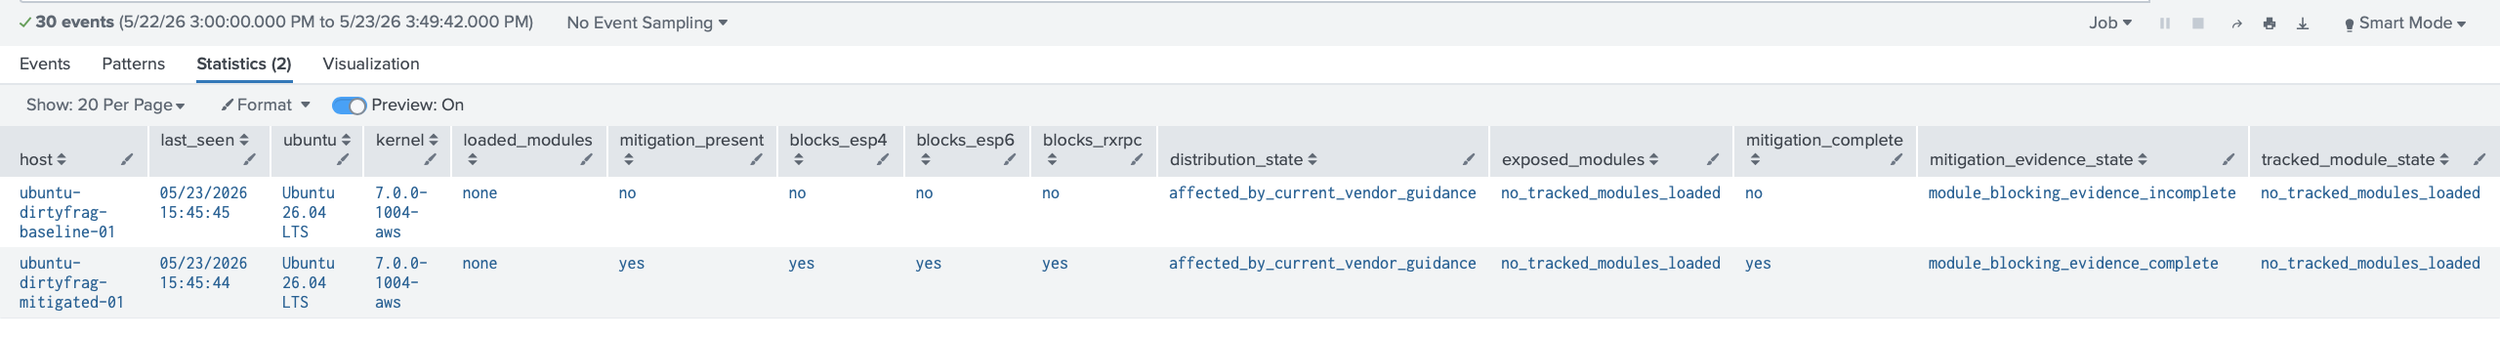
The host posture table deliberately separated module state from mitigation evidence: a host can have no tracked modules loaded and still lack the durable module-blocking configuration.
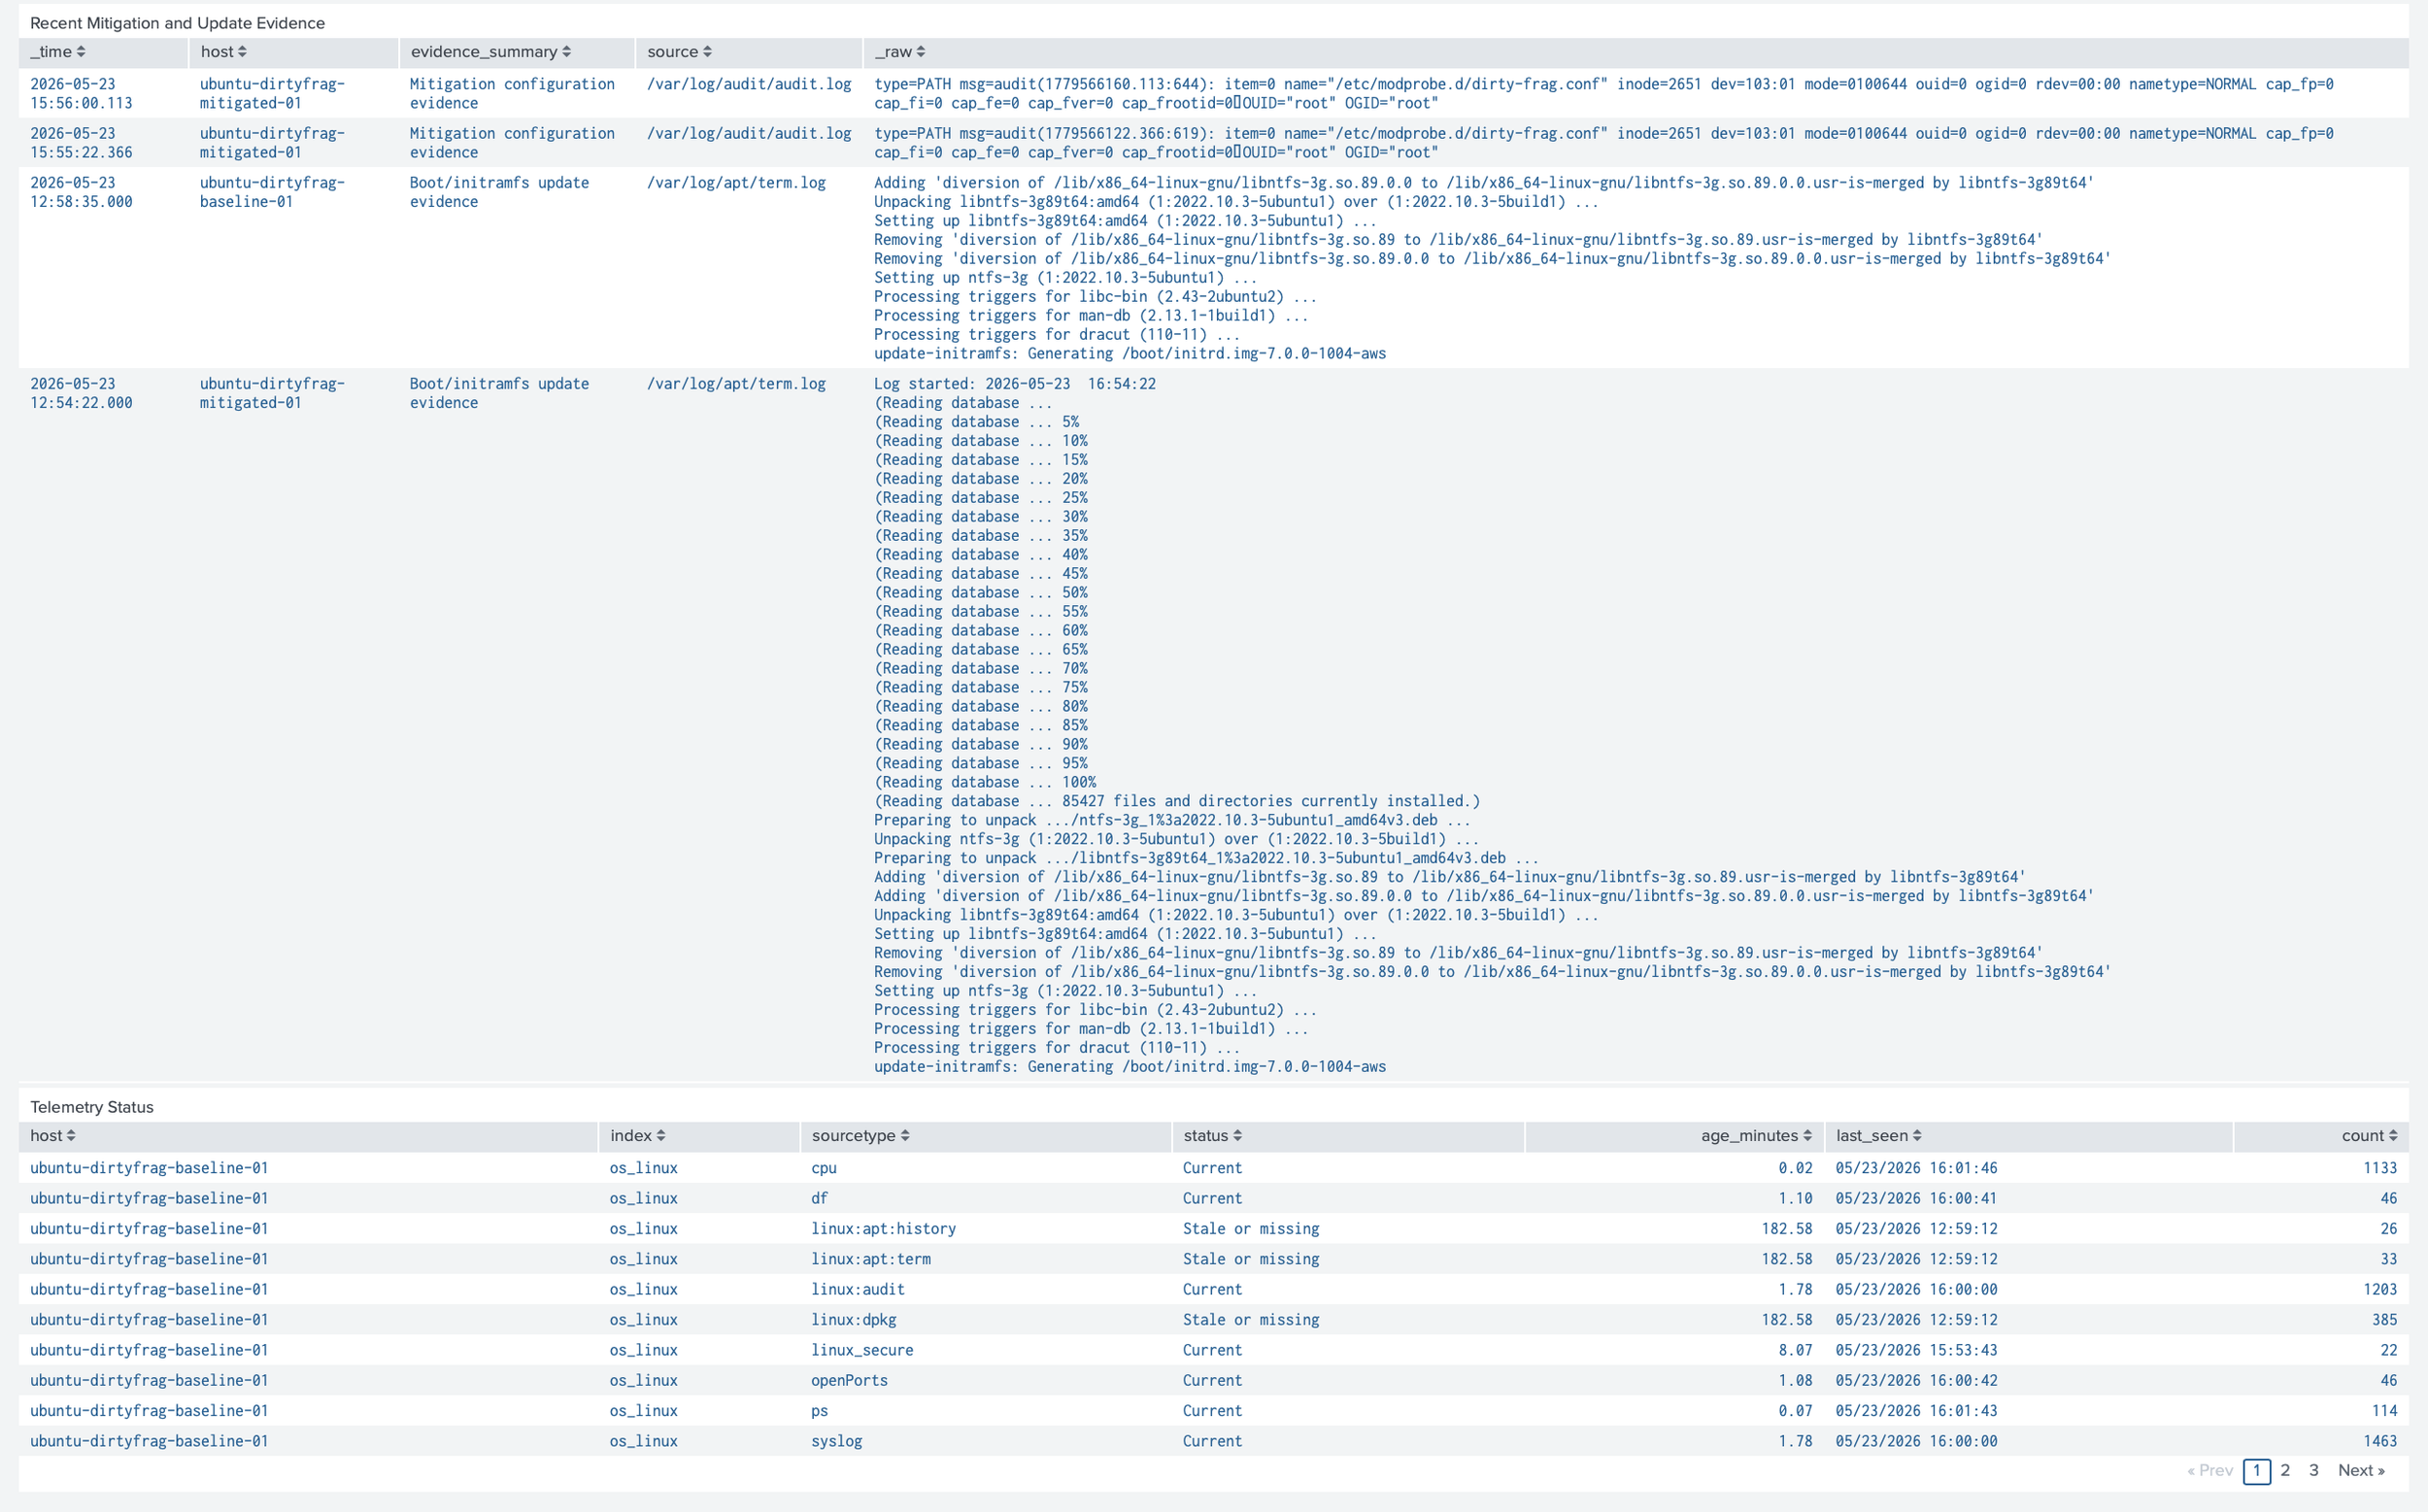
The dashboard also avoided claiming that module blocking alone equals full remediation or proof that exploitation never occurred; it treated mitigation evidence as one part of a larger validation story. For that reason, the technical dashboard included package and initramfs evidence so kernel updates and boot-time mitigation changes could be reviewed alongside the posture script.
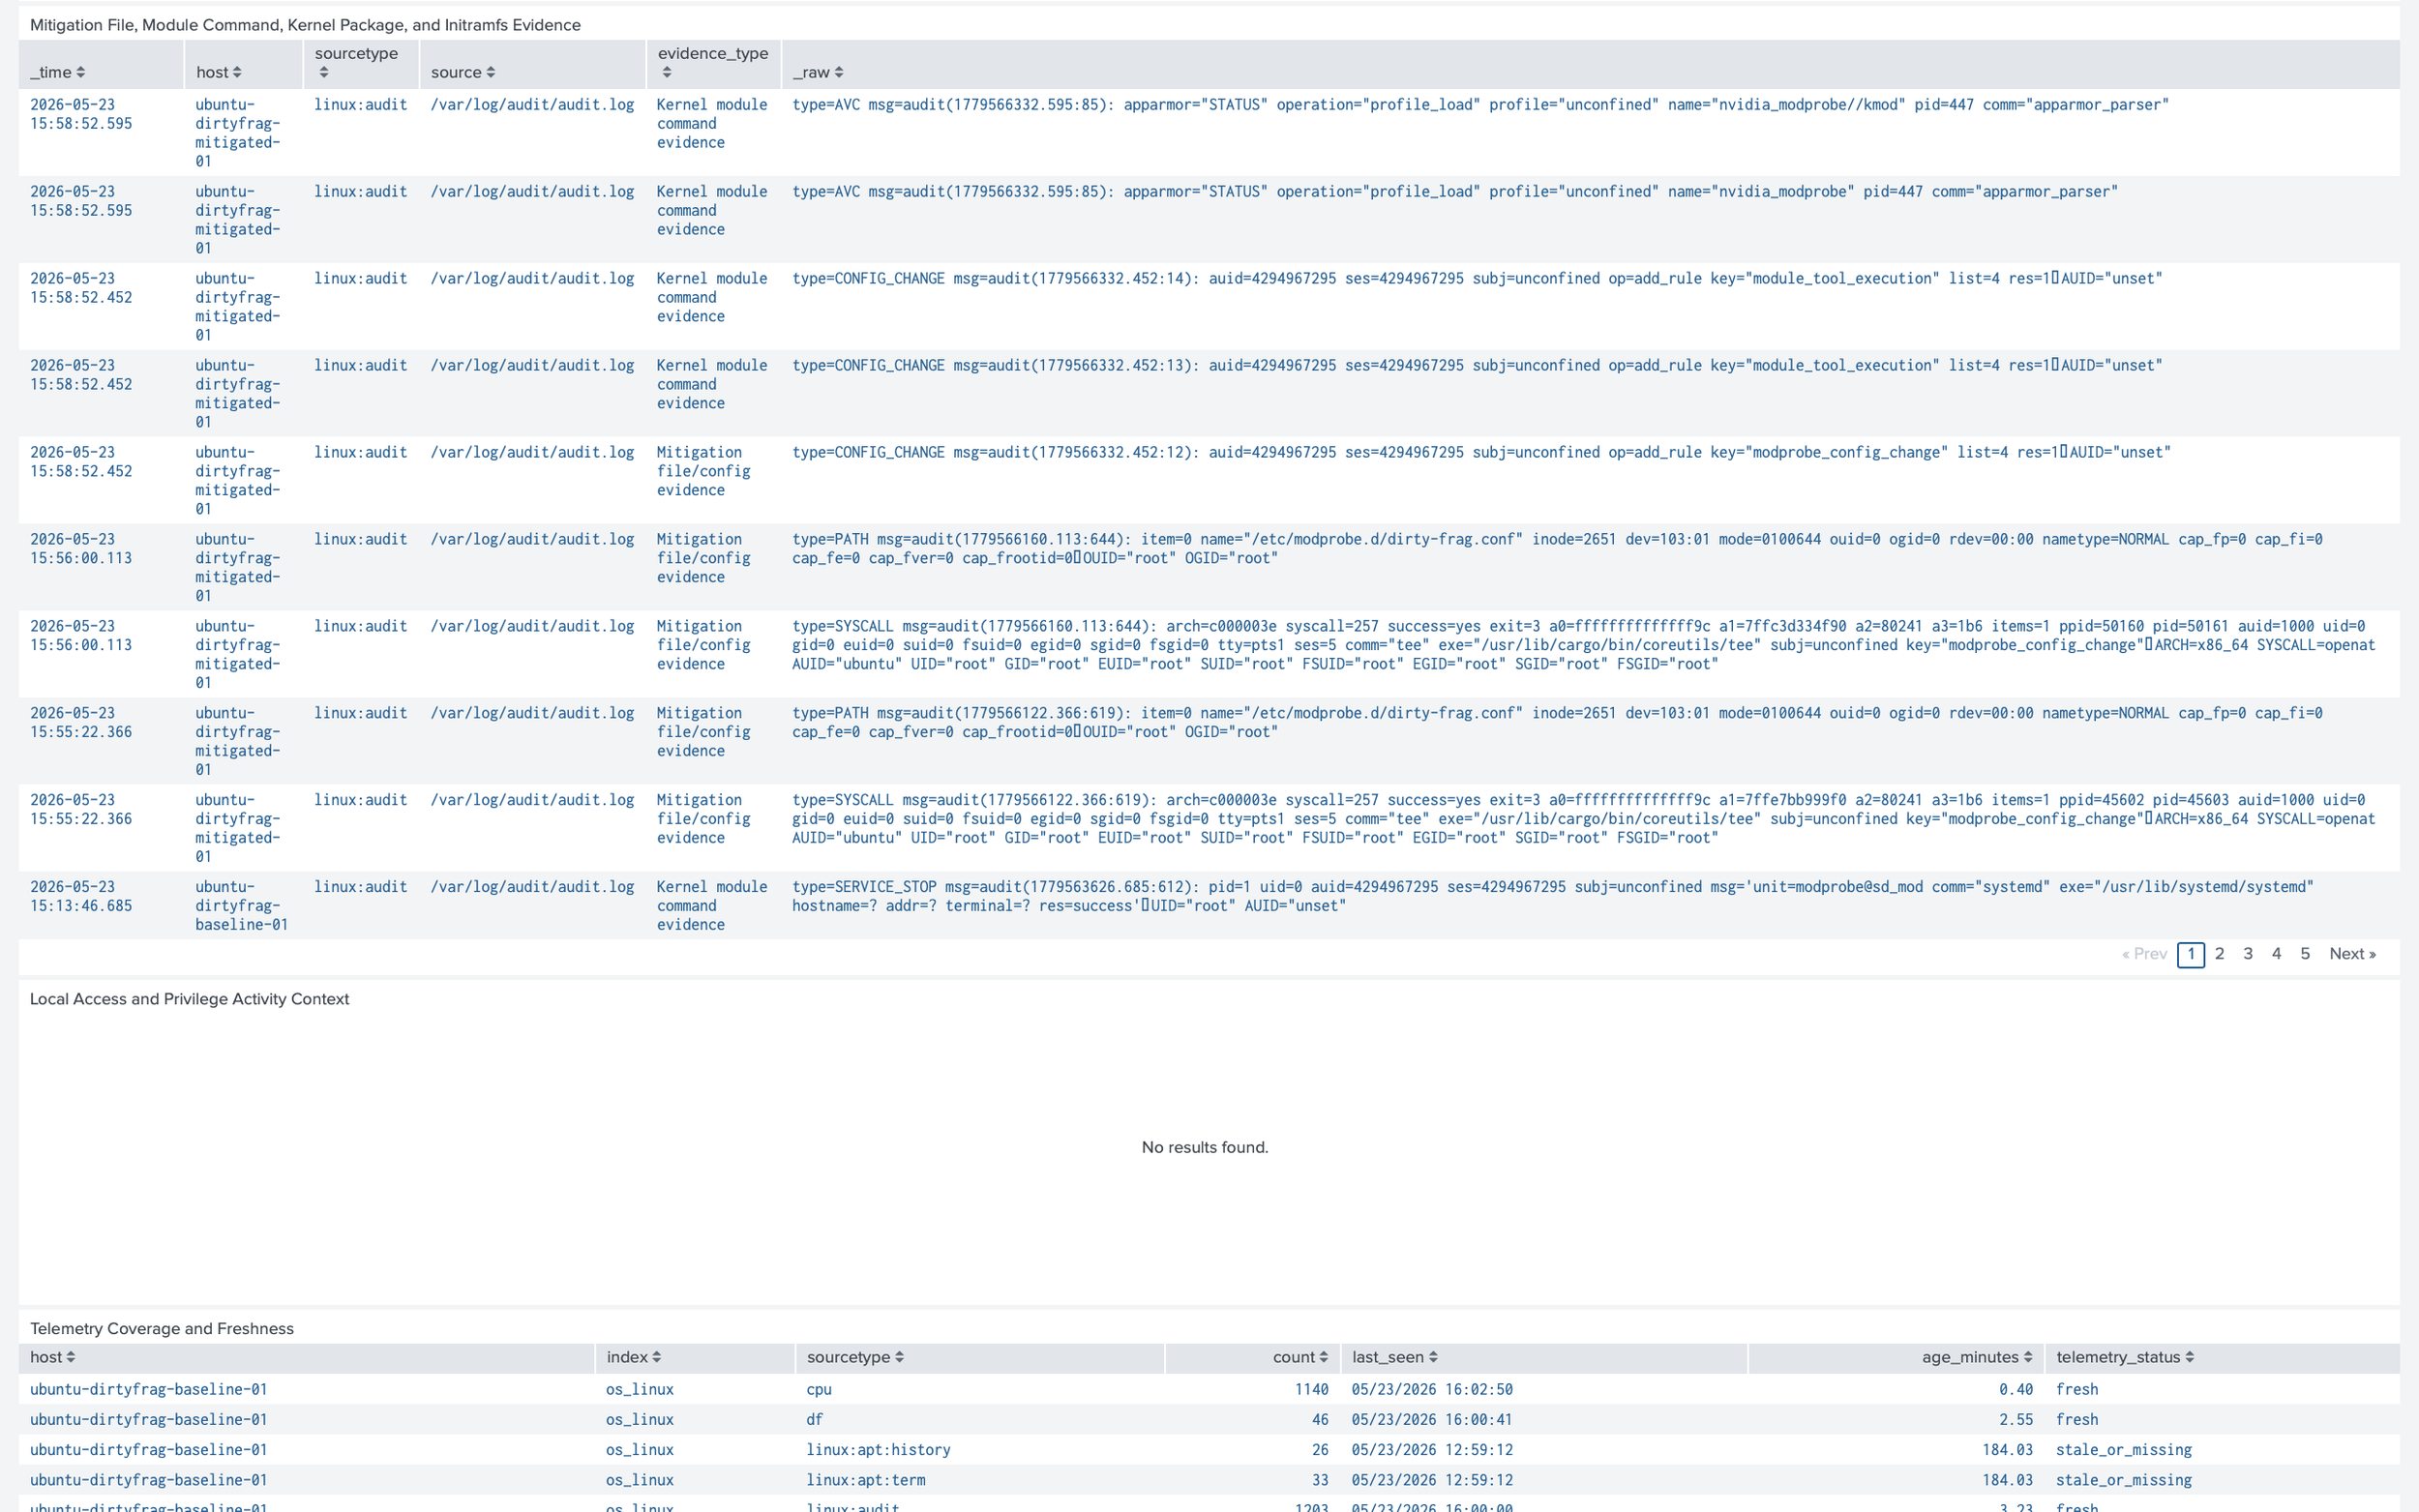
The auditd and package panels showed whether the lab captured changes to /etc/modprobe.d, module-tool execution, update-initramfs activity, and kernel package activity. The authentication and privilege panels added local-access context because Dirty Frag matters most after a foothold or local execution already exists.
The telemetry coverage panel prevented a false sense of safety by showing whether the expected os_linux and vuln_validation data sources were still current.
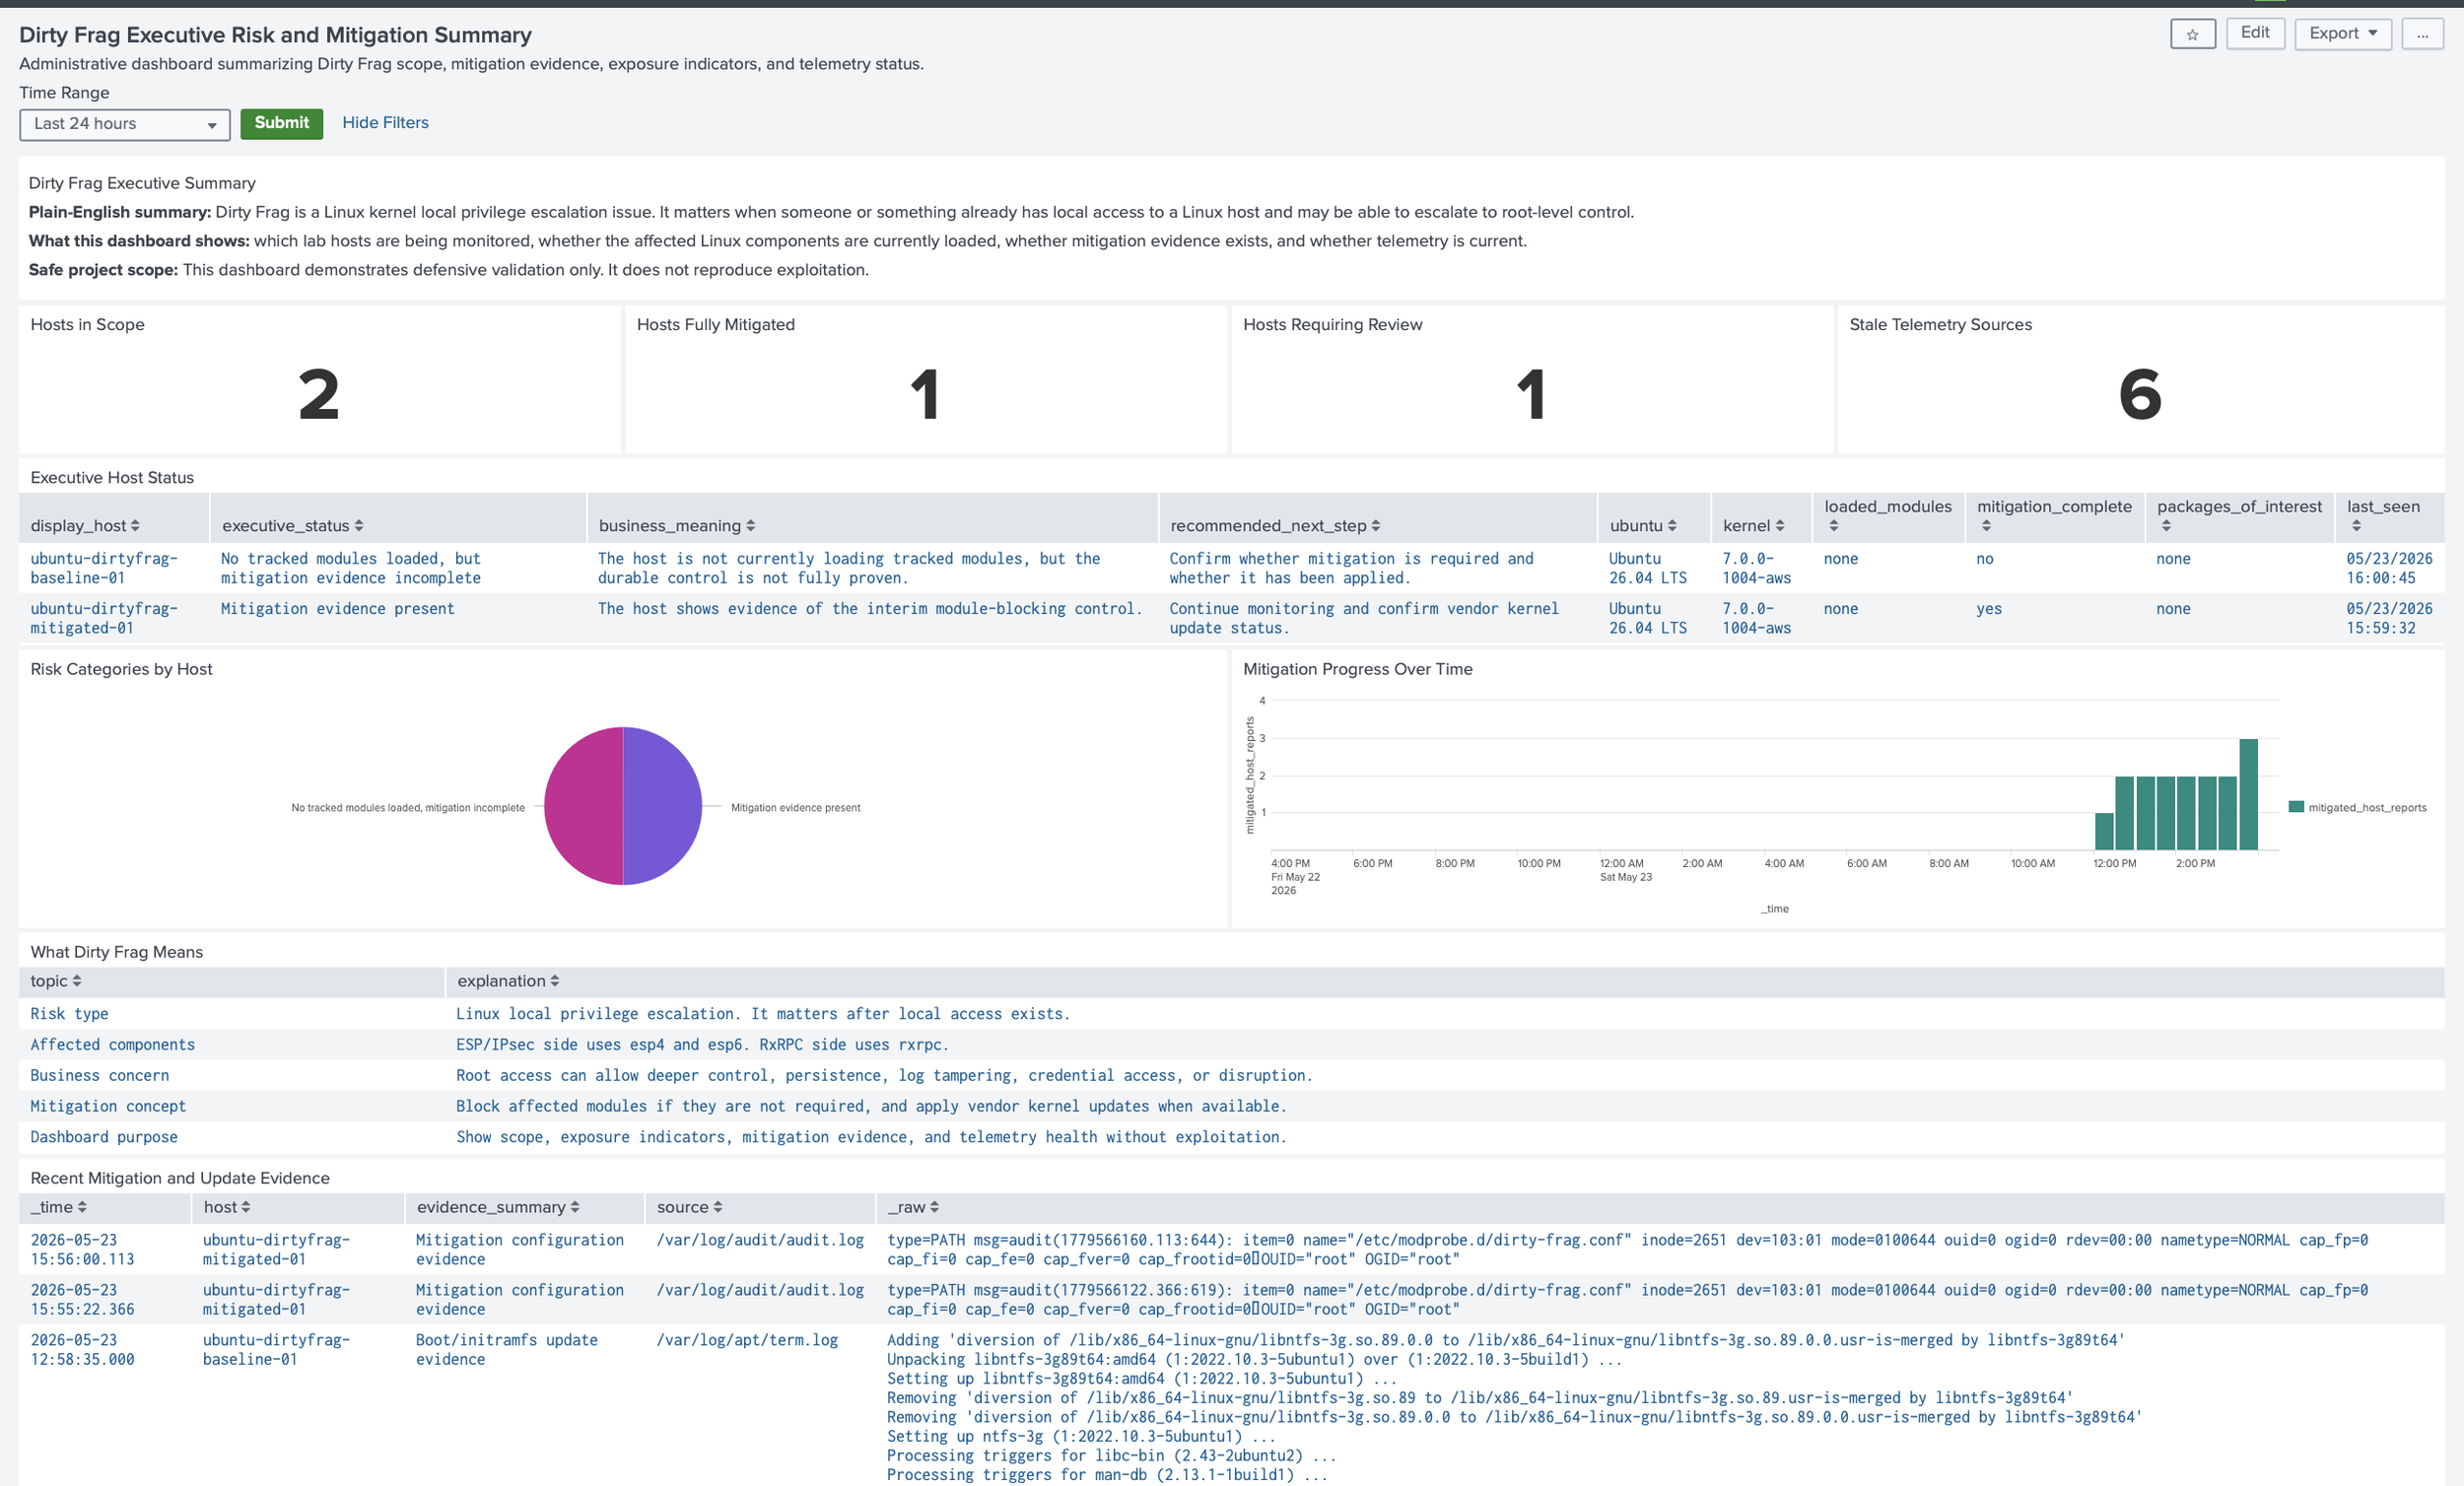
The executive dashboard used the same evidence but simplified the decision language. Its top-line panels showed hosts in scope, hosts fully mitigated, hosts requiring review, and stale telemetry sources.
The executive host status table translated technical fields such as loaded_modules, mitigation_present, and blocks_rxRPC into business-facing meanings and recommended next steps. The risk-category panel grouped hosts by whether tracked modules were loaded, mitigation evidence was present, or review was still required.
The ‘What Dirty Frag Means’ panel explained that Dirty Frag is a Linux kernel local privilege escalation issue, not an initial-access vulnerability, and that mitigation should reduce post-compromise risk while vendor patching remains the long-term remediation path.
Together, the two dashboards showed that the project was not a simple vulnerable-or-not-vulnerable exercise. They showed the full defensive workflow: identify the CVEs, map them to Linux components, collect posture and OS telemetry, compare baseline and mitigated hosts, validate mitigation evidence, and confirm the hosts continued reporting.
This made the Dirty Frag homelab credible for both technical reviewers and administrative readers because the dashboards showed what changed, what remained uncertain, and what evidence supported each conclusion.
What I Learned
This project made the homelab feel less like a group of servers and more like a small security validation environment. The ISC/SANS StormCast podcast and supporting Dirty Frag write-up gave me the starting point, but the real work was translating that reporting into safe, testable questions inside my own AWS Splunk lab.
The biggest shift was moving from "what are the CVEs?" to "what can I prove with evidence?" I wanted to prove which Ubuntu hosts were in scope, which Dirty Frag-related components were relevant, whether esp4, esp6, or rxrpc were loaded, whether mitigation evidence existed, and whether telemetry stayed healthy after changes were made.
The technical dashboard helped turn those questions into something reviewable. It connected the CVE mapping, host posture, kernel version, module state, mitigation file evidence, package and initramfs activity, auditd evidence, authentication context, and telemetry freshness in one place. That made the project more than a set of disconnected searches; it became an evidence trail that a Linux administrator, Splunk professional, or security analyst could inspect.
The executive dashboard forced a different kind of discipline. Instead of assuming every reader would understand kernel modules or RxRPC, it summarized the same evidence in plain language: hosts in scope, hosts fully mitigated, hosts requiring review, stale telemetry sources, business meaning, and recommended next steps. That helped me practice translating a technical Linux vulnerability into operational risk, control status, and decision-ready reporting.
This mattered because Dirty Frag is not just a patching headline. It is a local privilege escalation risk, so the surrounding context matters: local access, sudo activity, root sessions, package changes, module state, mitigation evidence, and whether the host is still reporting. A dashboard is only useful if the data behind it is current enough to trust.
The project also reinforced a more careful way to talk about mitigation. A host with no tracked modules loaded is not automatically patched, and a host with module-blocking evidence is not automatically proven uncompromised. The more accurate claim is that the lab can show module state, mitigation evidence, update activity, and telemetry health at a point in time.
The main lesson was that strong security work depends on evidence quality. I did not need to exploit Dirty Frag to show that I understood it. I needed to scope the issue, collect the right telemetry, validate assumptions, apply a controlled mitigation, verify the result, and make the outcome understandable to both technical and nontechnical reviewers.
That is the habit I want this homelab to keep strengthening: read credible reporting, translate it into defensive questions, build the telemetry, validate the change, and communicate the result clearly.
How to Reproduce
Start by reviewing the SANS ISC item and current vendor guidance. For Dirty Frag, confirm the CVEs, affected components, affected distribution guidance, mitigation notes, and regression risks before touching any system. These details can change quickly when kernel fixes and distribution guidance are still evolving.
Next, choose safe lab hosts. I used Ubuntu EC2 instances in AWS and kept them isolated from unnecessary exposure. Install the Splunk Universal Forwarder, connect it to the Deployment Server, and validate forwarding before adding more data sources.
Install or deploy the Linux collection pieces deliberately. The Splunk Add-on for Unix and Linux can help with standard Linux inputs. I used a custom Dirty Frag posture script to gather information per Ubuntu host. In a distributed lab, keep collection on the Universal Forwarders, index definitions on the indexer cluster, and dashboards or search-time knowledge on the search head cluster.
Onboard the basic telemetry first: authentication logs, system logs, audit logs, apt logs, dpkg logs, and a small posture script. The posture script should only collect read-only information such as kernel version, loaded module state, and mitigation file status.
Then validate the baseline. Confirm whether esp4, esp6, or rxrpc are loaded. Confirm whether the mitigation file exists. Confirm whether the host uses IPsec, VPN, AFS, or RxRPC-related functionality. Document the answer before making changes.
Apply mitigation only after documenting the expected impact. For Ubuntu, that may include preventing the affected modules from loading, unloading modules, checking whether they are still loaded, and rebooting if required. After mitigation, rerun the posture script and Splunk searches to prove the host state changed.
Finally, build the dashboard and save the evidence. Keep screenshots of the source item, architecture diagram, AWS instance scope, security groups, Deployment Server server class, forwarder status, baseline posture, dashboard before state, mitigation activity, update-initramfs or package logs, audit events, dashboard after state, and missing-telemetry panel. The goal is not just to change the lab. The goal is to make the process understandable to someone else.
Conclusion
Dirty Frag gave me a practical reason to test whether my Splunk AWS homelab could support a real defensive workflow. The value was not in reproducing exploitation. The value was in taking current threat reporting from SANS ISC, understanding the affected components, collecting the right Ubuntu telemetry, and proving the before-and-after state in Splunk.
The dashboard became the center of the project because it made the evidence easier to review. It connected the CVEs, modules, hosts, mitigation status, package activity, audit records, and telemetry health in one place. That is the kind of visibility I want from a lab: not just more logs, but better answers.
This project also reminded me that good security work often starts with slower questions. What is actually affected? What does the mitigation change? What could it break? What evidence would convince someone else that the change worked? Those questions matter in a homelab because they matter in real environments.
I hope this blog post inspires someone to create their own homelab, test new CVEs safely, understand how mitigations work, and practice turning vulnerability reporting into defensive validation. Feel free to reach out if you have feedback on any part of the project, including the implementation approach, telemetry design, dashboard structure, or mitigation strategy.
The views expressed here are my own and do not represent any employer or organization.
Sources Consulted
SANS Internet Storm Center StormCast, Monday May 11, 2026: New Linux Priv Escalation; PAM Backdoors; CPanel Updates; Let's Encrypt. https://isc.sans.edu/podcastdetail/9926
SANS ISC diary: Another Universal Linux Local Privilege Escalation (LPE) Vulnerability: Dirty Frag. https://isc.sans.edu/diary/32968
Ubuntu: Dirty Frag Linux kernel local privilege escalation vulnerability mitigations. https://ubuntu.com/blog/dirty-frag-linux-vulnerability-fixes-available
Microsoft Security Blog: Active attack: Dirty Frag Linux vulnerability expands post-compromise risk. https://www.microsoft.com/en-us/security/blog/2026/05/08/active-attack-dirty-frag-linux-vulnerability-expands-post-compromise-risk/
Splunk documentation: Splunk Add-on for Unix and Linux. https://splunk.github.io/splunk-add-on-for-unix-and-linux/
Splunk documentation: Use forwarders to get data into the indexer cluster. https://help.splunk.com/en/data-management/manage-splunk-enterprise-indexers/9.1/get-data-into-the-indexer-cluster/use-forwarders-to-get-data-into-the-indexer-cluster