Extending My Splunk AWS Homelab: VPC Flow Logs, Cloud Network Visibility, and Splunk Validation
Problem
After building my Linux host firewall project, I wanted to add another layer of visibility to the same AWS environment. UFW logs helped me understand what the Ubuntu host accepted or denied, but I also wanted to see what AWS observed at the VPC network layer.
The question behind this project was simple: can I add VPC Flow Logs to my Splunk AWS homelab and use them to validate network behavior from the cloud side?
This matters because defense in depth is not only about adding controls. It is also about understanding where each control sits and what evidence it can provide. A Security Group, a Linux host firewall, a web server log, and a VPC Flow Log do not answer the same question. Together, they give a clearer picture.
Lab Setup
I used my existing distributed Splunk Enterprise homelab in AWS as the foundation. The environment already included indexer clustering, search head clustering, a Deployment Server, a Management Server, Universal Forwarder-based host logging, and a Heavy Forwarder available for AWS data collection.
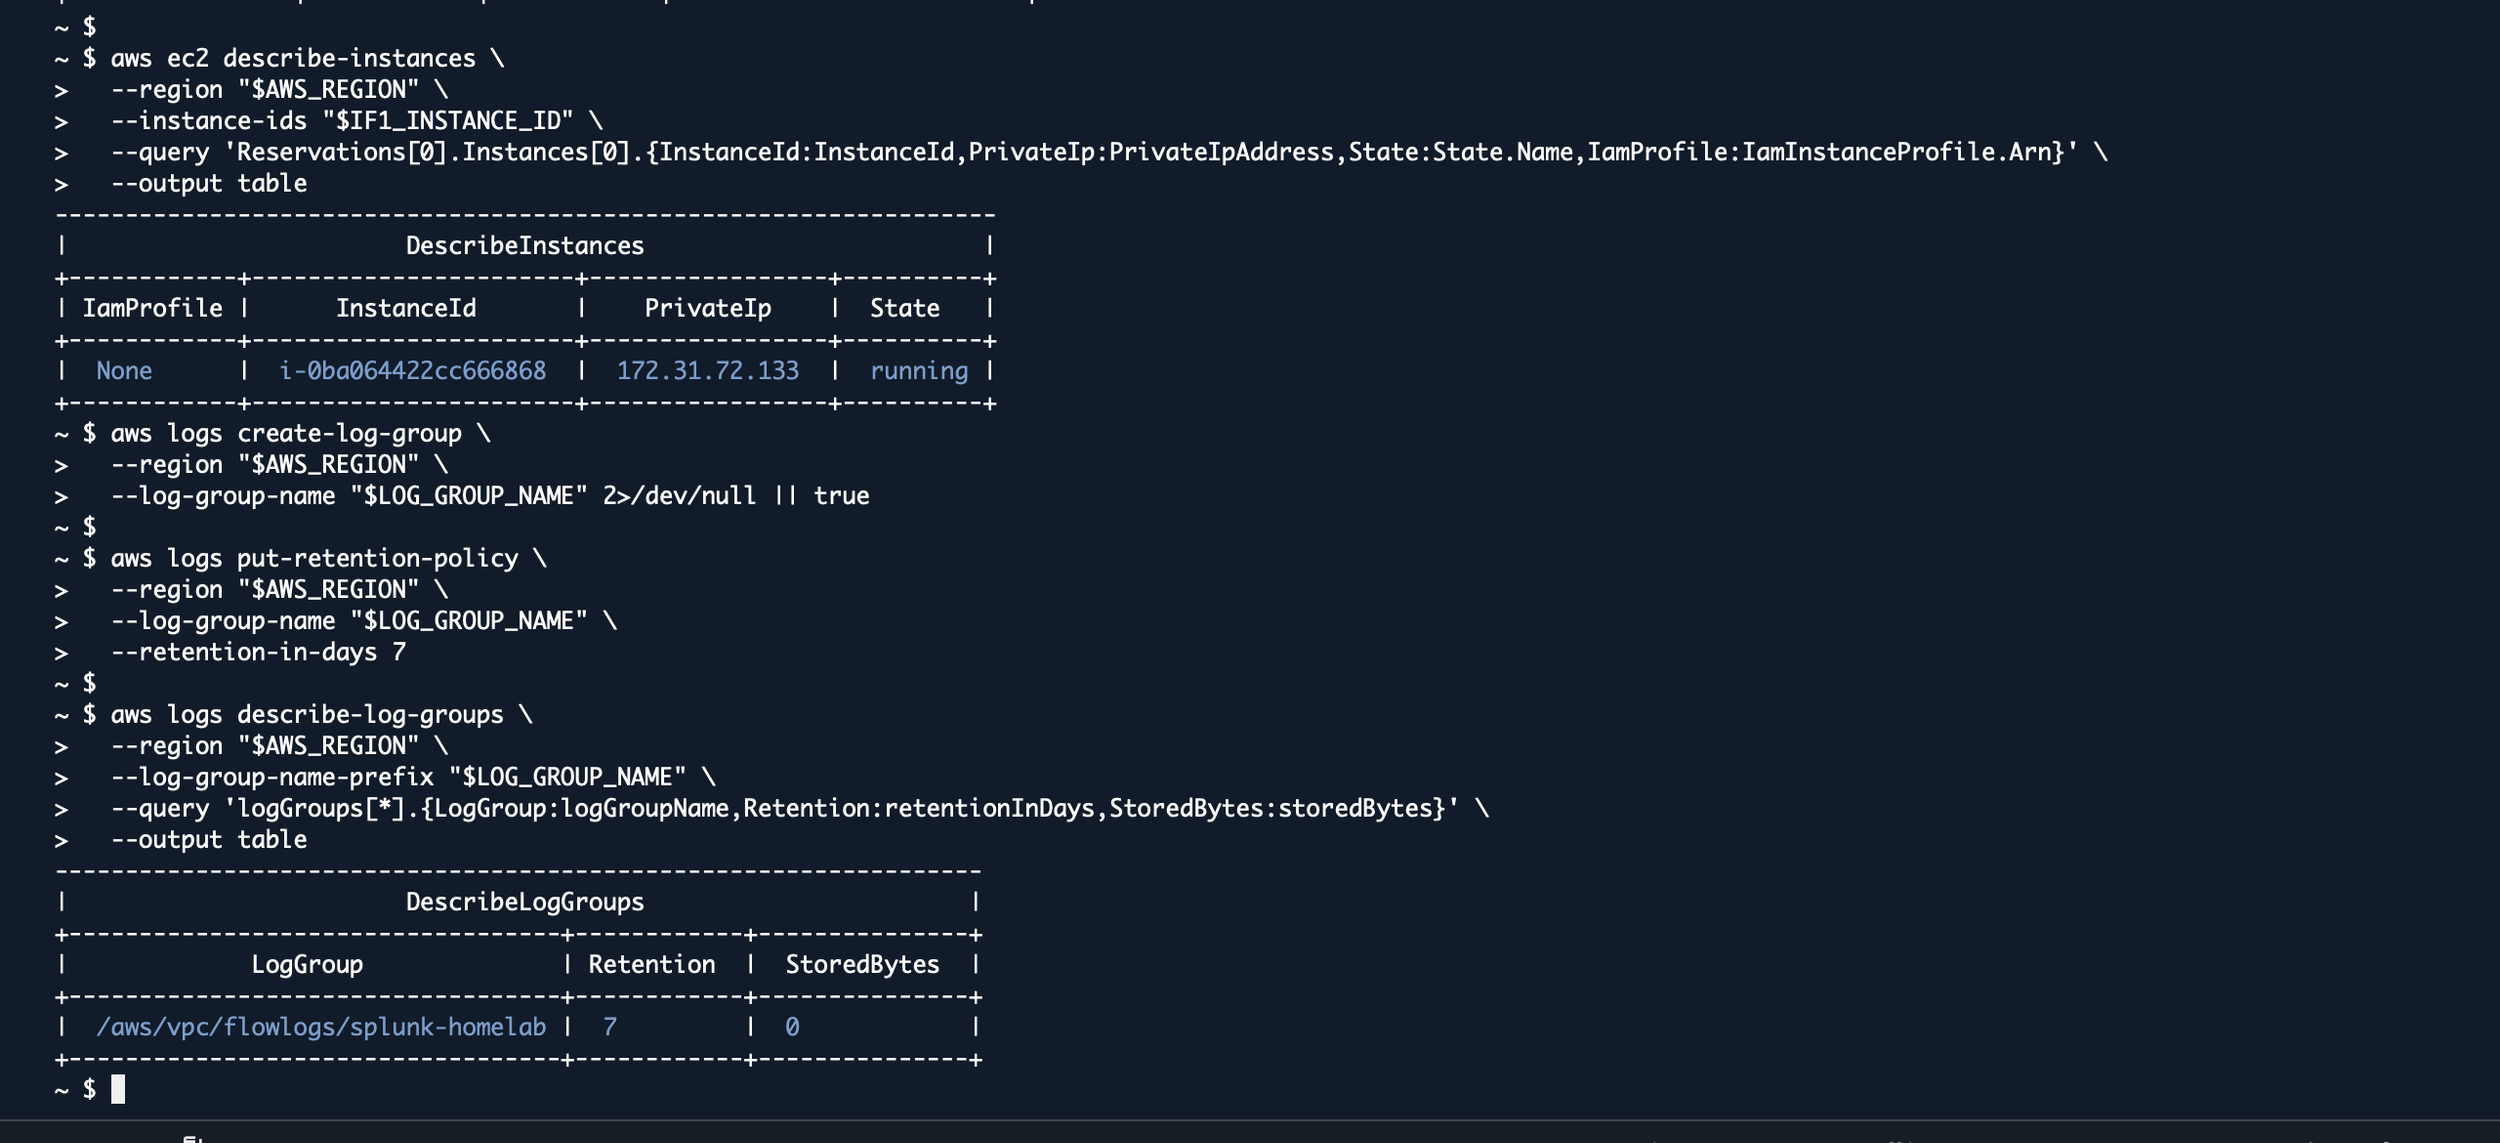
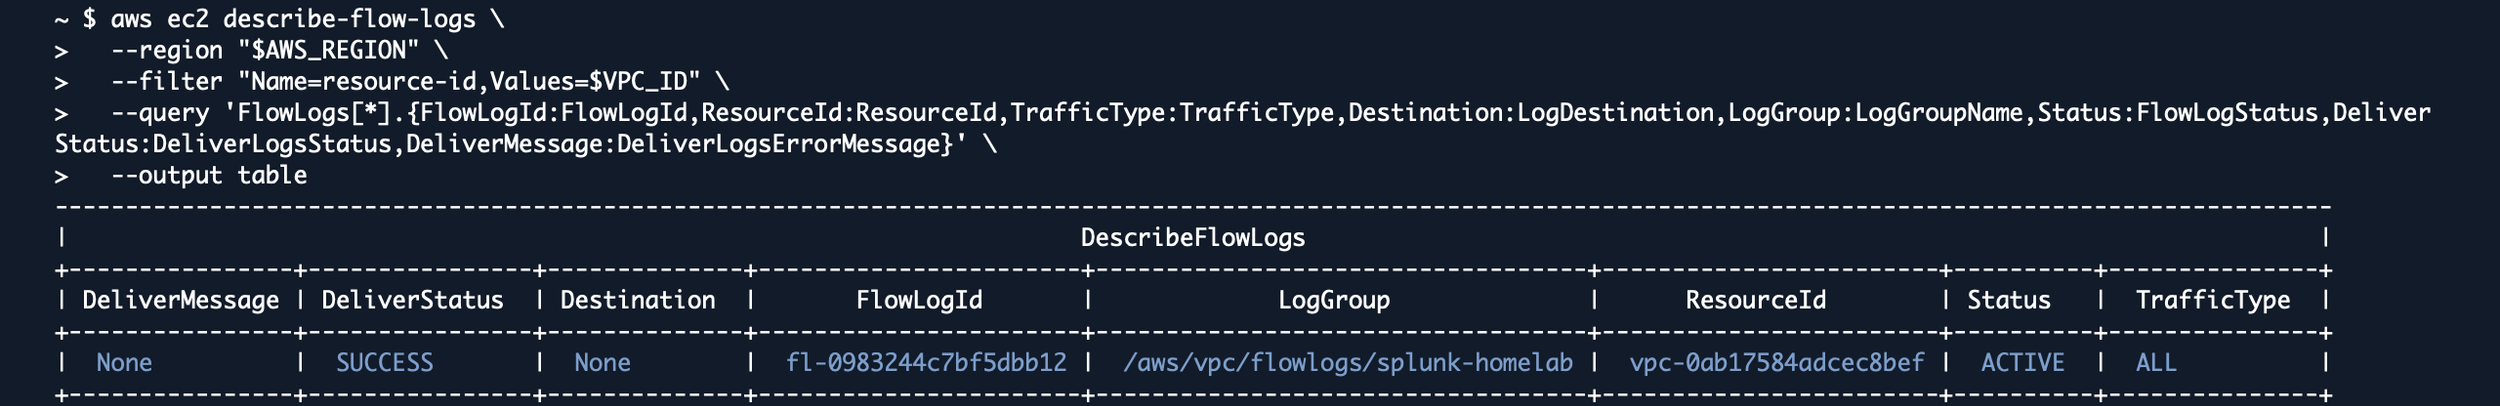
For this project, I enabled VPC Flow Logs for the lab VPC and sent the records to Amazon CloudWatch Logs. Then I used the Splunk Add-on for AWS on the Heavy Forwarder to pull those records into a dedicated Splunk index.
I kept the initial scope small. The goal was not to ingest every possible AWS data source. The goal was to add one useful network telemetry source, validate that it arrived correctly, and build a dashboard that made the data easy to review.
What I Built
The AWS side produced VPC Flow Logs for accepted and rejected traffic. Those records include useful network metadata such as source address, destination address, source port, destination port, protocol, packet count, byte count, action, and log status.
The Splunk side used a dedicated index for AWS network telemetry and the aws:cloudwatchlogs:vpcflow sourcetype. I wanted the VPC Flow Logs to be separate enough to search clearly, but still available for comparison with Linux firewall logs and other host data.
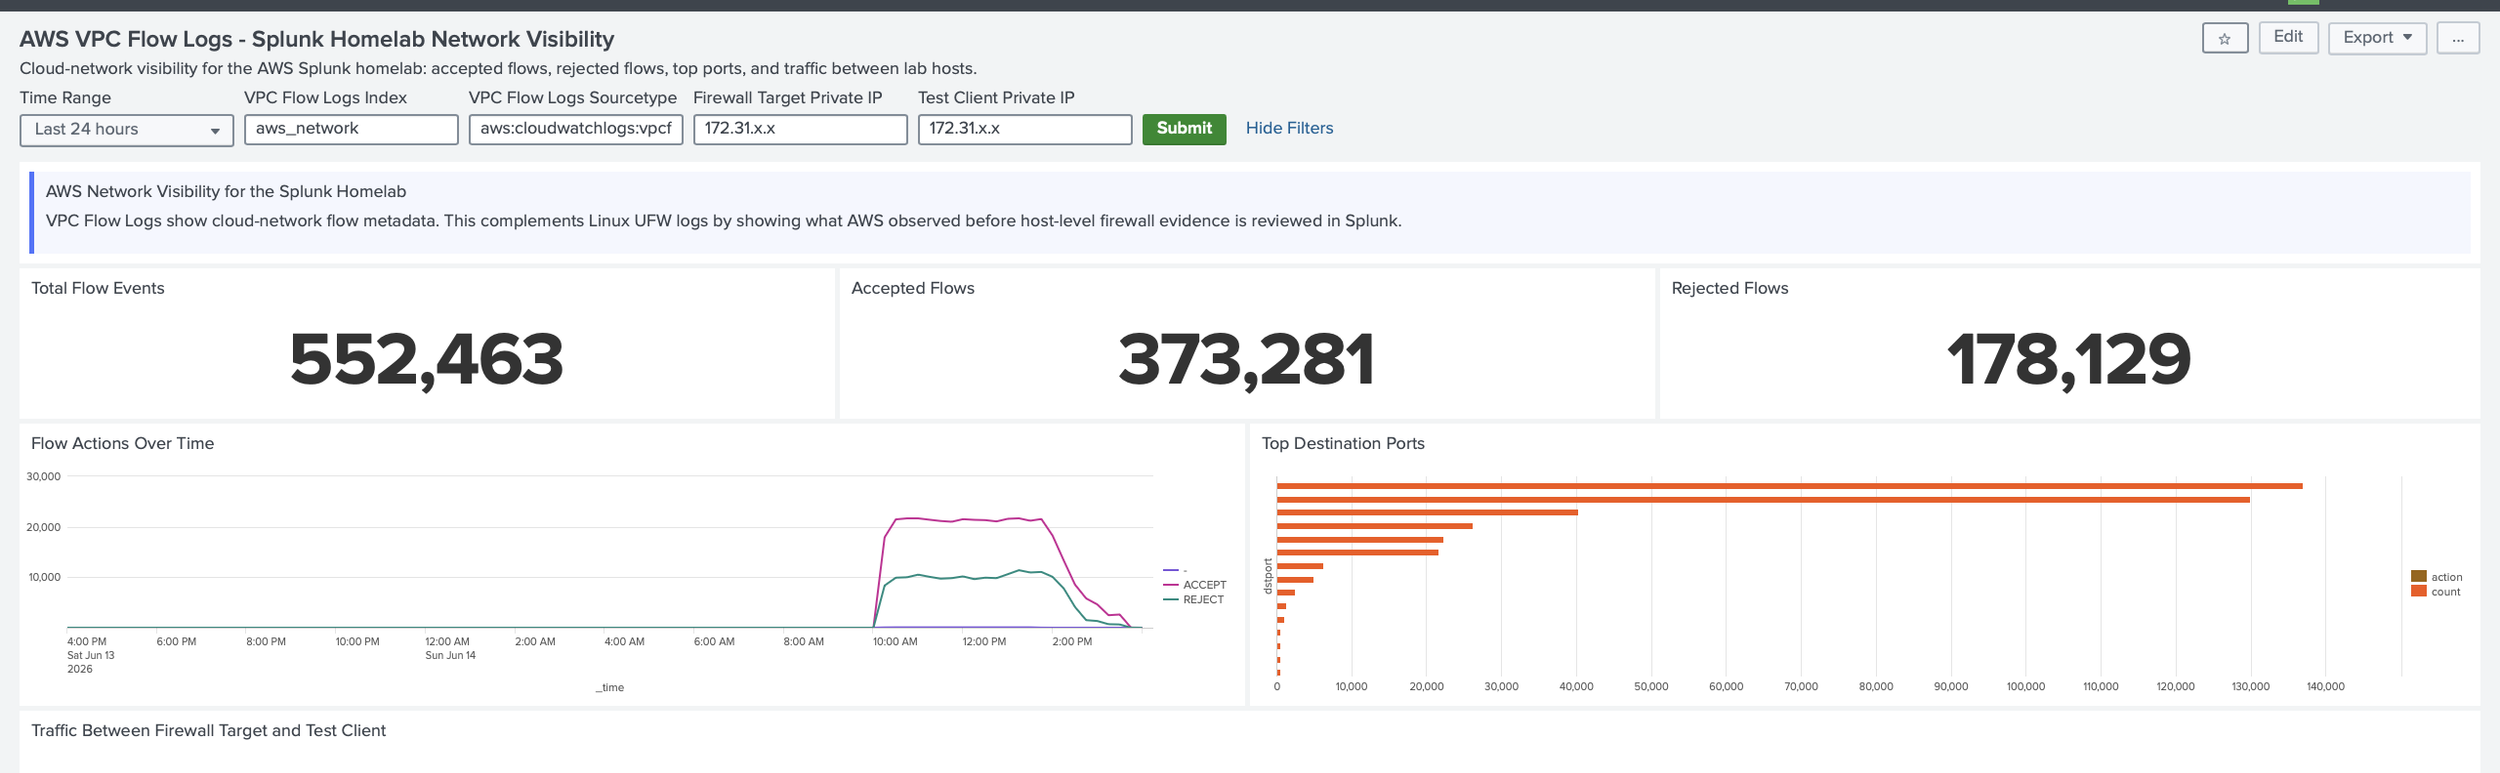
The dashboard focused on practical questions: how much flow data is arriving, which flows are accepted or rejected, which ports are most active, and what traffic is visible between the firewall target host and test client.
Security and Implementation Notes
VPC Flow Logs are useful, but they are not packet captures. They show flow metadata, not packet payloads. That distinction matters because the data can show that traffic happened, where it went, and whether AWS accepted or rejected it, but it cannot explain application-layer content by itself.
I also treated cost and scope as part of the design. Flow logs can create a lot of data, especially in a busy VPC. For a homelab, a short retention period and a focused dashboard were enough to practice the workflow without creating unnecessary noise.
The important lesson was that VPC Flow Logs complement the host firewall dashboard. AWS can show what the cloud network observed. UFW can show what the Linux host denied. NGINX can show what the application handled. Splunk gives me a place to put those perspectives together.
What I Learned
This project helped me see the same network path from another angle. In the firewall lab, the focus was the Linux host. With VPC Flow Logs, the focus moved outward to the AWS network layer.
That shift was useful because it made the architecture more concrete. A packet may be allowed by a Security Group, denied by a host firewall, handled by an application, or logged by Splunk afterward. Each layer tells part of the story, but none of them tells the whole story alone.
How to Reproduce
Start by choosing the VPC or subnet you want to monitor. For a small homelab, start with one VPC and a short retention period.
Create a CloudWatch Logs log group for the flow logs, then create the IAM role that allows the VPC Flow Logs service to publish records to that log group.
Create the VPC Flow Log with a Splunk-supported field order and use a dedicated Splunk index such as aws_network. Generate controlled traffic between your test hosts so there is something to validate.
Install and configure the Splunk Add-on for AWS on the Heavy Forwarder for data collection, and deploy the add-on to the Search Heads and Indexers as needed for search-time and index-time knowledge. Then configure a CloudWatch Logs input for the VPC Flow Logs log group and validate the data in Splunk before building the dashboard.
Build the dashboard after the data is confirmed. The dashboard should show accepted flows, rejected flows, destination ports, traffic between lab hosts, and the source/sourcetype health of the VPC Flow Log events.
Next Improvements
Longer term, I want to add CloudTrail, tighter outbound rules, routing-table review, NAT visibility, and eventually BGP-focused lab work. The goal is to keep connecting networking fundamentals to real security telemetry.
Conclusion
This project helped me add cloud-network visibility to my Splunk AWS homelab. VPC Flow Logs did not replace the host firewall work; they added another perspective.
The biggest takeaway was that good monitoring depends on knowing what each data source can show. VPC Flow Logs show network-flow metadata from the AWS side. UFW logs show host-firewall decisions. Application logs show what the service handled. Splunk helps bring those views together.
More than anything, this project reinforced the value of a homelab: a safe environment to test ideas, validate assumptions, troubleshoot issues, and turn abstract cloud-security concepts into practical monitoring experience.
The views expressed here are my own and do not represent any employer or organization.