Designing and Validating a Distributed Splunk Enterprise Homelab in AWS
Problem
I built this Splunk Enterprise homelab in AWS to practice the parts of security monitoring that happen before an alert ever fires: cloud design, Linux host preparation, Splunk role separation, forwarding, indexing, validation, and operational visibility.
Skills demonstrated: Splunk Enterprise architecture, indexer clustering, search head clustering, AWS EC2 networking, Ubuntu administration, deployment server management, forwarder validation, security group design, EBS encryption, log onboarding planning, and security operations documentation.
Improving requires consistent practice, not a one-time build. A Splunk homelab gives me that foundation: a place to work with data, study how Splunk parses it, explore what it shows, and learn things I did not see before.
The question behind this project was simple: what has to be true before a security analyst can trust the data in Splunk? Logs need to come from the right systems, forward reliably, parse consistently, land in the correct indexes, remain searchable, and stay protected. In real environments, investigations, detections, dashboards, and reporting are only as strong as the data pipeline behind them.
I wanted more than a working installation. I wanted to go several layers deeper and gain hands-on experience with the architecture behind it. What assumptions was I making in AWS, Ubuntu, networking, access control, and service configuration? What would a Splunk architect notice in my design, data flow, deployment choices, or scalability assumptions?
The short-term goal was preparing for the Splunk Enterprise Practical Deployment Lab. The longer-term goal is to build a foundation for detection engineering, cloud logging, endpoint telemetry, automation, and future projects. I also wanted to give back to others who are learning. If one person uses this post to make a better design choice, validate one more layer, or avoid opening an unnecessary path, it was worth sharing.
Lab Setup
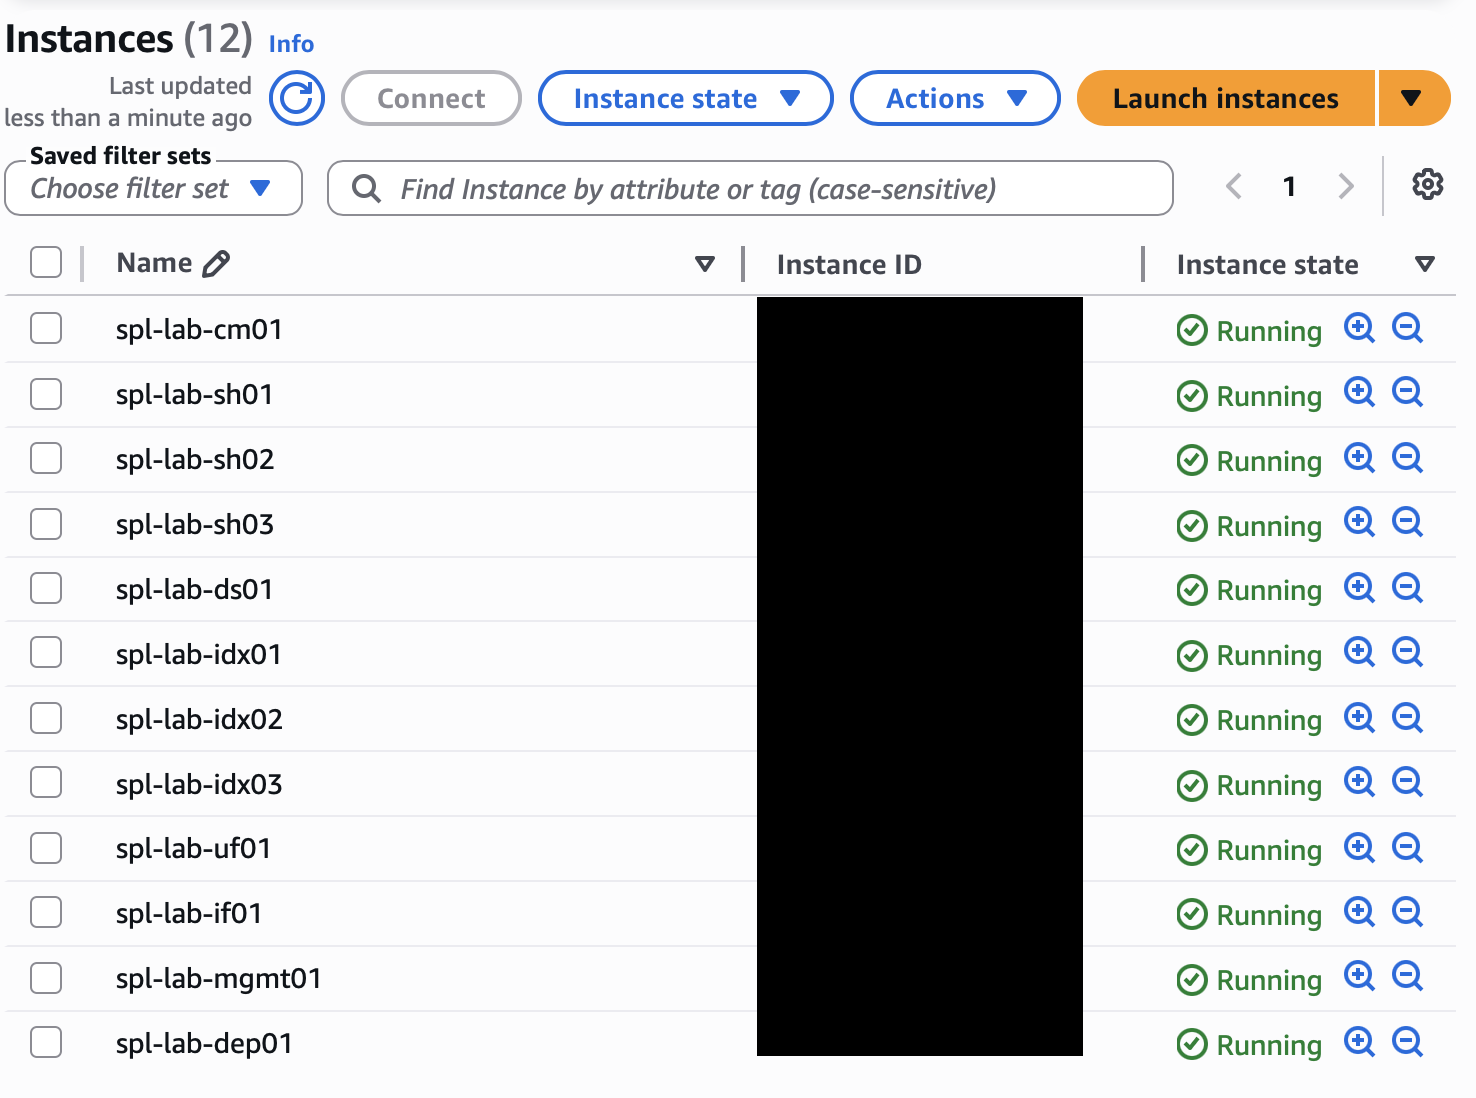
I built the lab in AWS using x86_64 Ubuntu EC2 instances. The goal was not just to deploy a working Splunk environment, but to separate responsibilities clearly enough that I could explain what each layer was doing and validate how data moved from source to search.
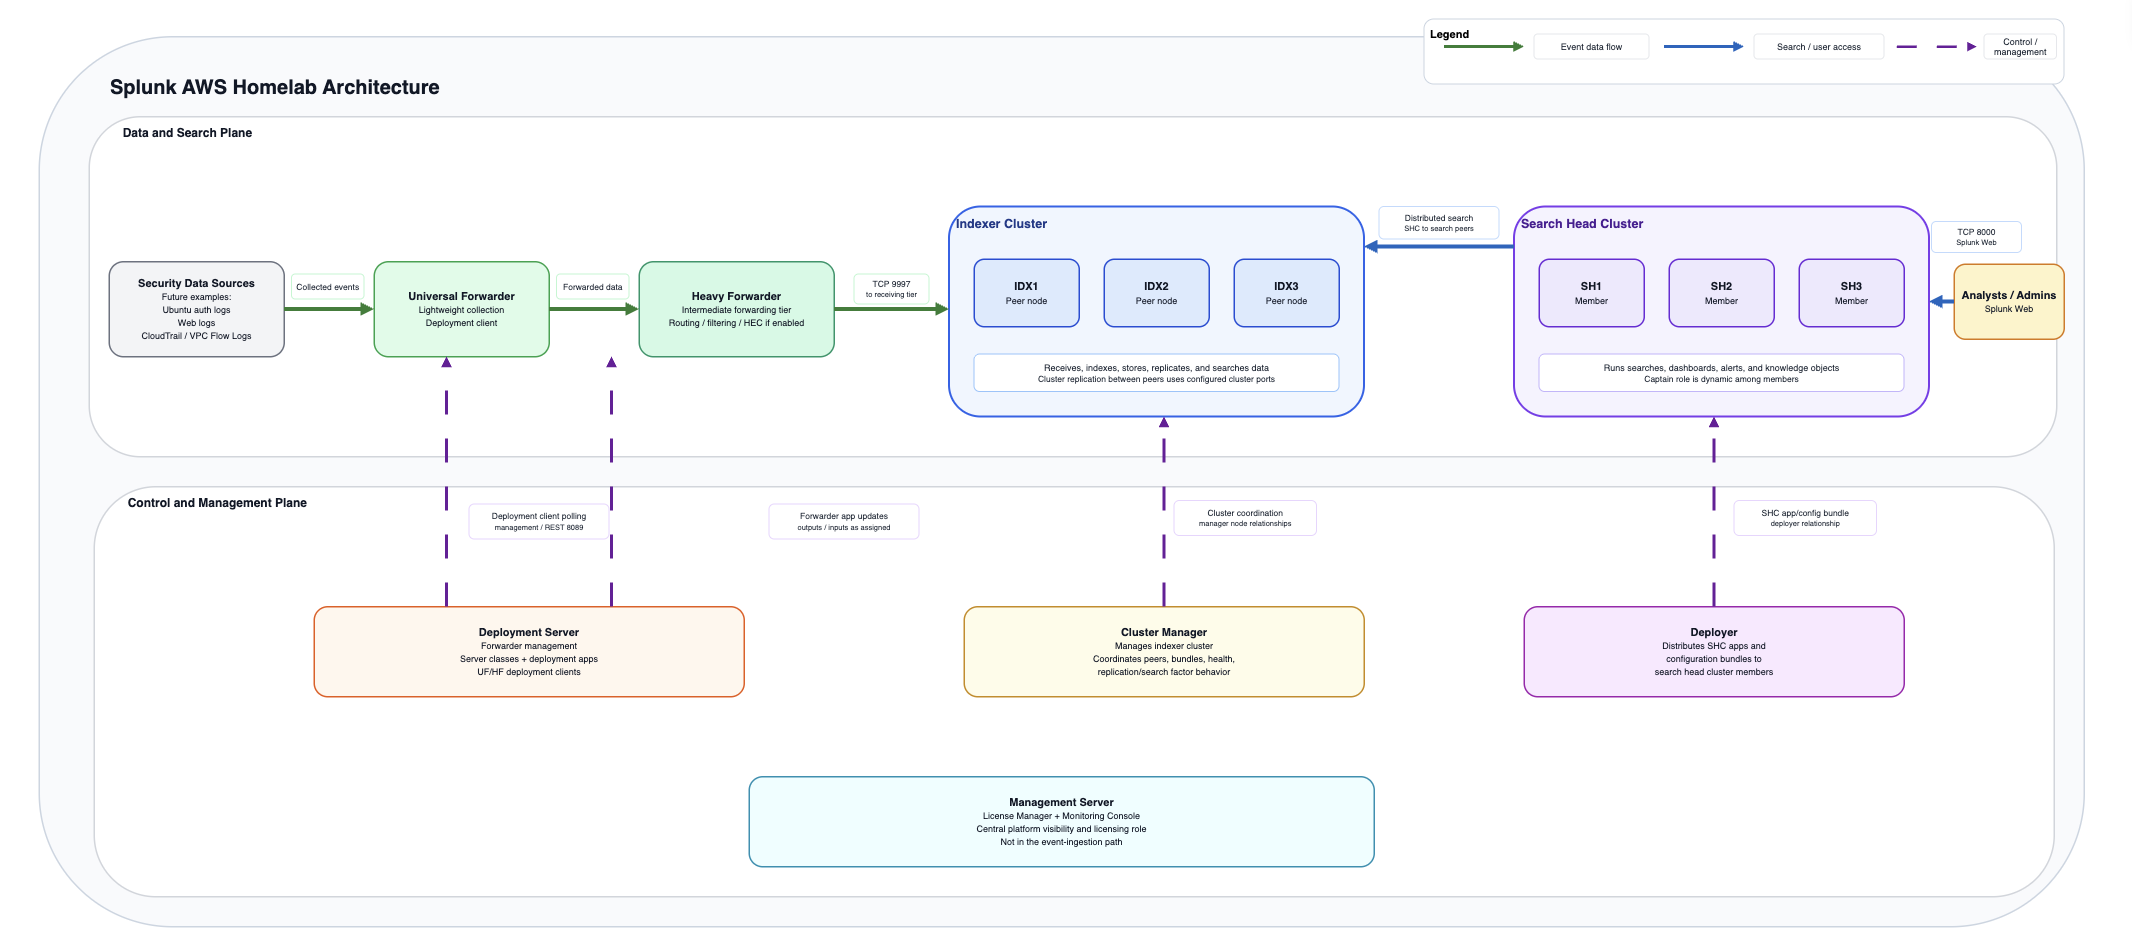
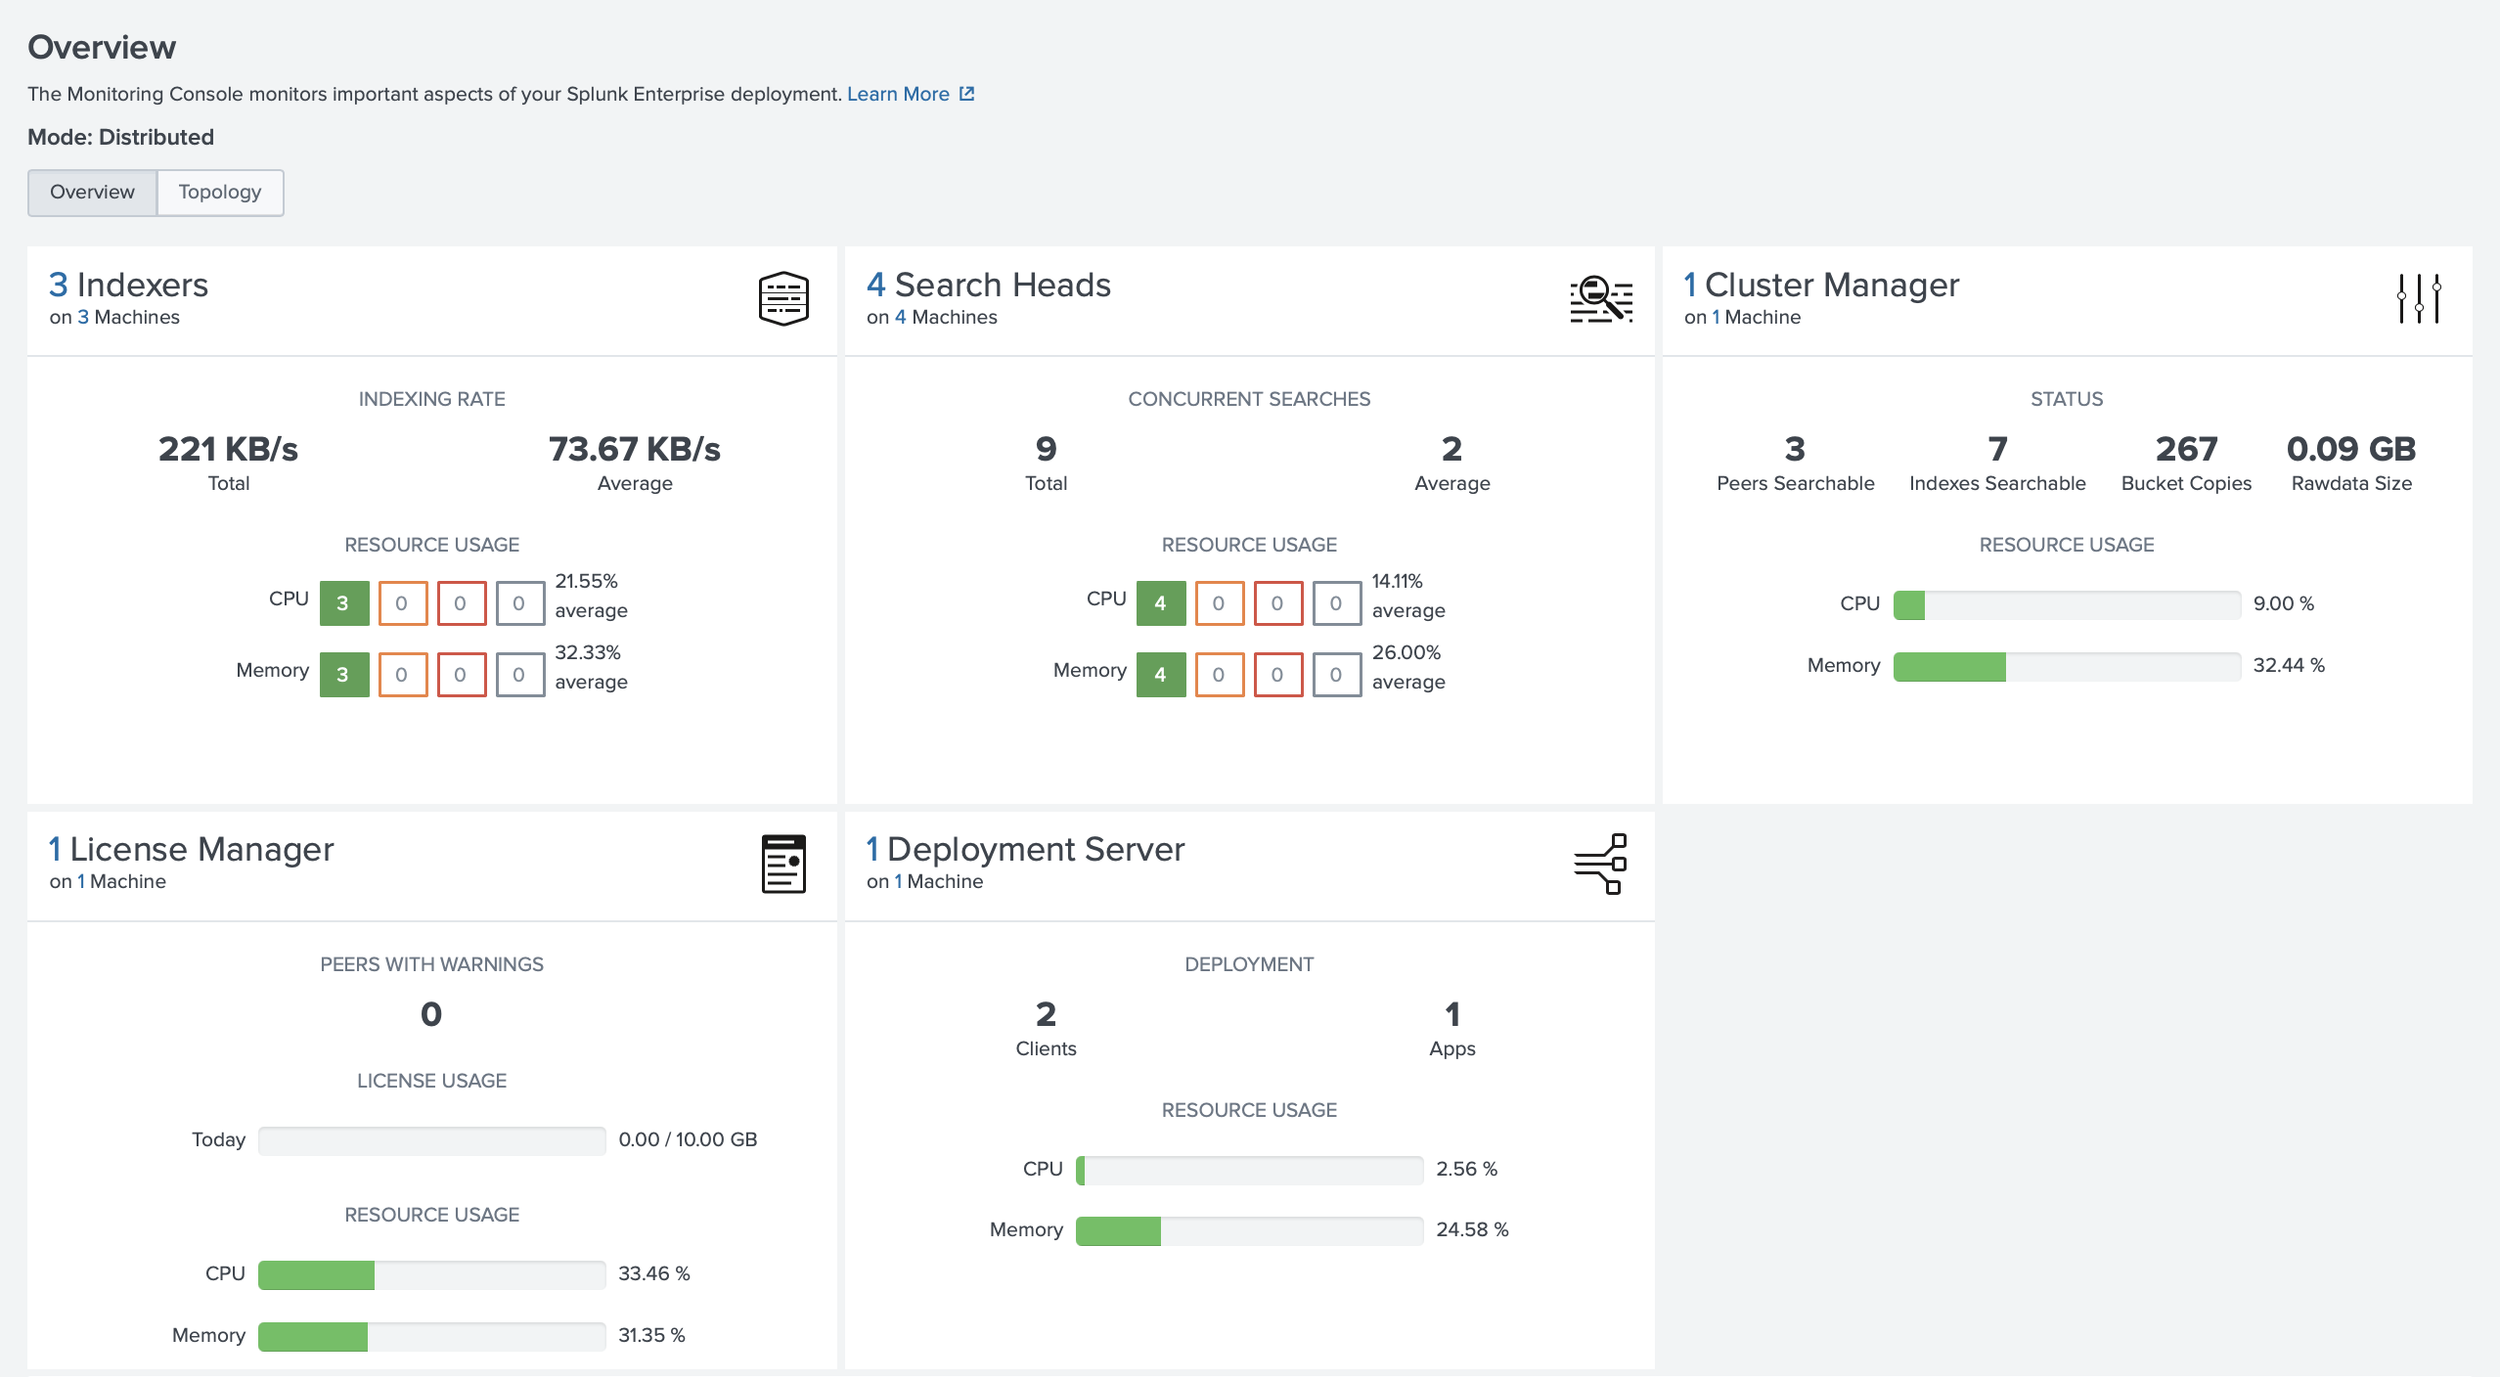
The environment included a Cluster Manager, three indexers, three search heads, a Deployer, a Deployment Server, a Management Server running the License Manager and Monitoring Console, a Universal Forwarder, and an intermediate forwarding tier using a Heavy Forwarder. Each major Splunk role had a clear purpose instead of living on one system.
Building it this way forced me to slow down and think through the architecture. Which systems actually need to communicate? Which ports are required for each role? Which traffic should stay private? How would I know if forwarding stopped, replication failed, or indexers became unhealthy? Could I explain the environment without relying only on the diagram?
What I Built
I organized the lab around role separation rather than a single all-in-one Splunk instance. The management layer included a Cluster Manager, a Deployment Server, and a separate Management Server for the License Manager and Monitoring Console. The Cluster Manager coordinated indexer cluster membership, replication status, generation status, and health. The Management Server hosted the License Manager and Monitoring Console in this lab, giving me visibility into licensing, platform health, forwarding behavior, and indexing issues. I wanted this visibility early because unhealthy peers, delayed forwarding, or license issues can quietly affect investigations.
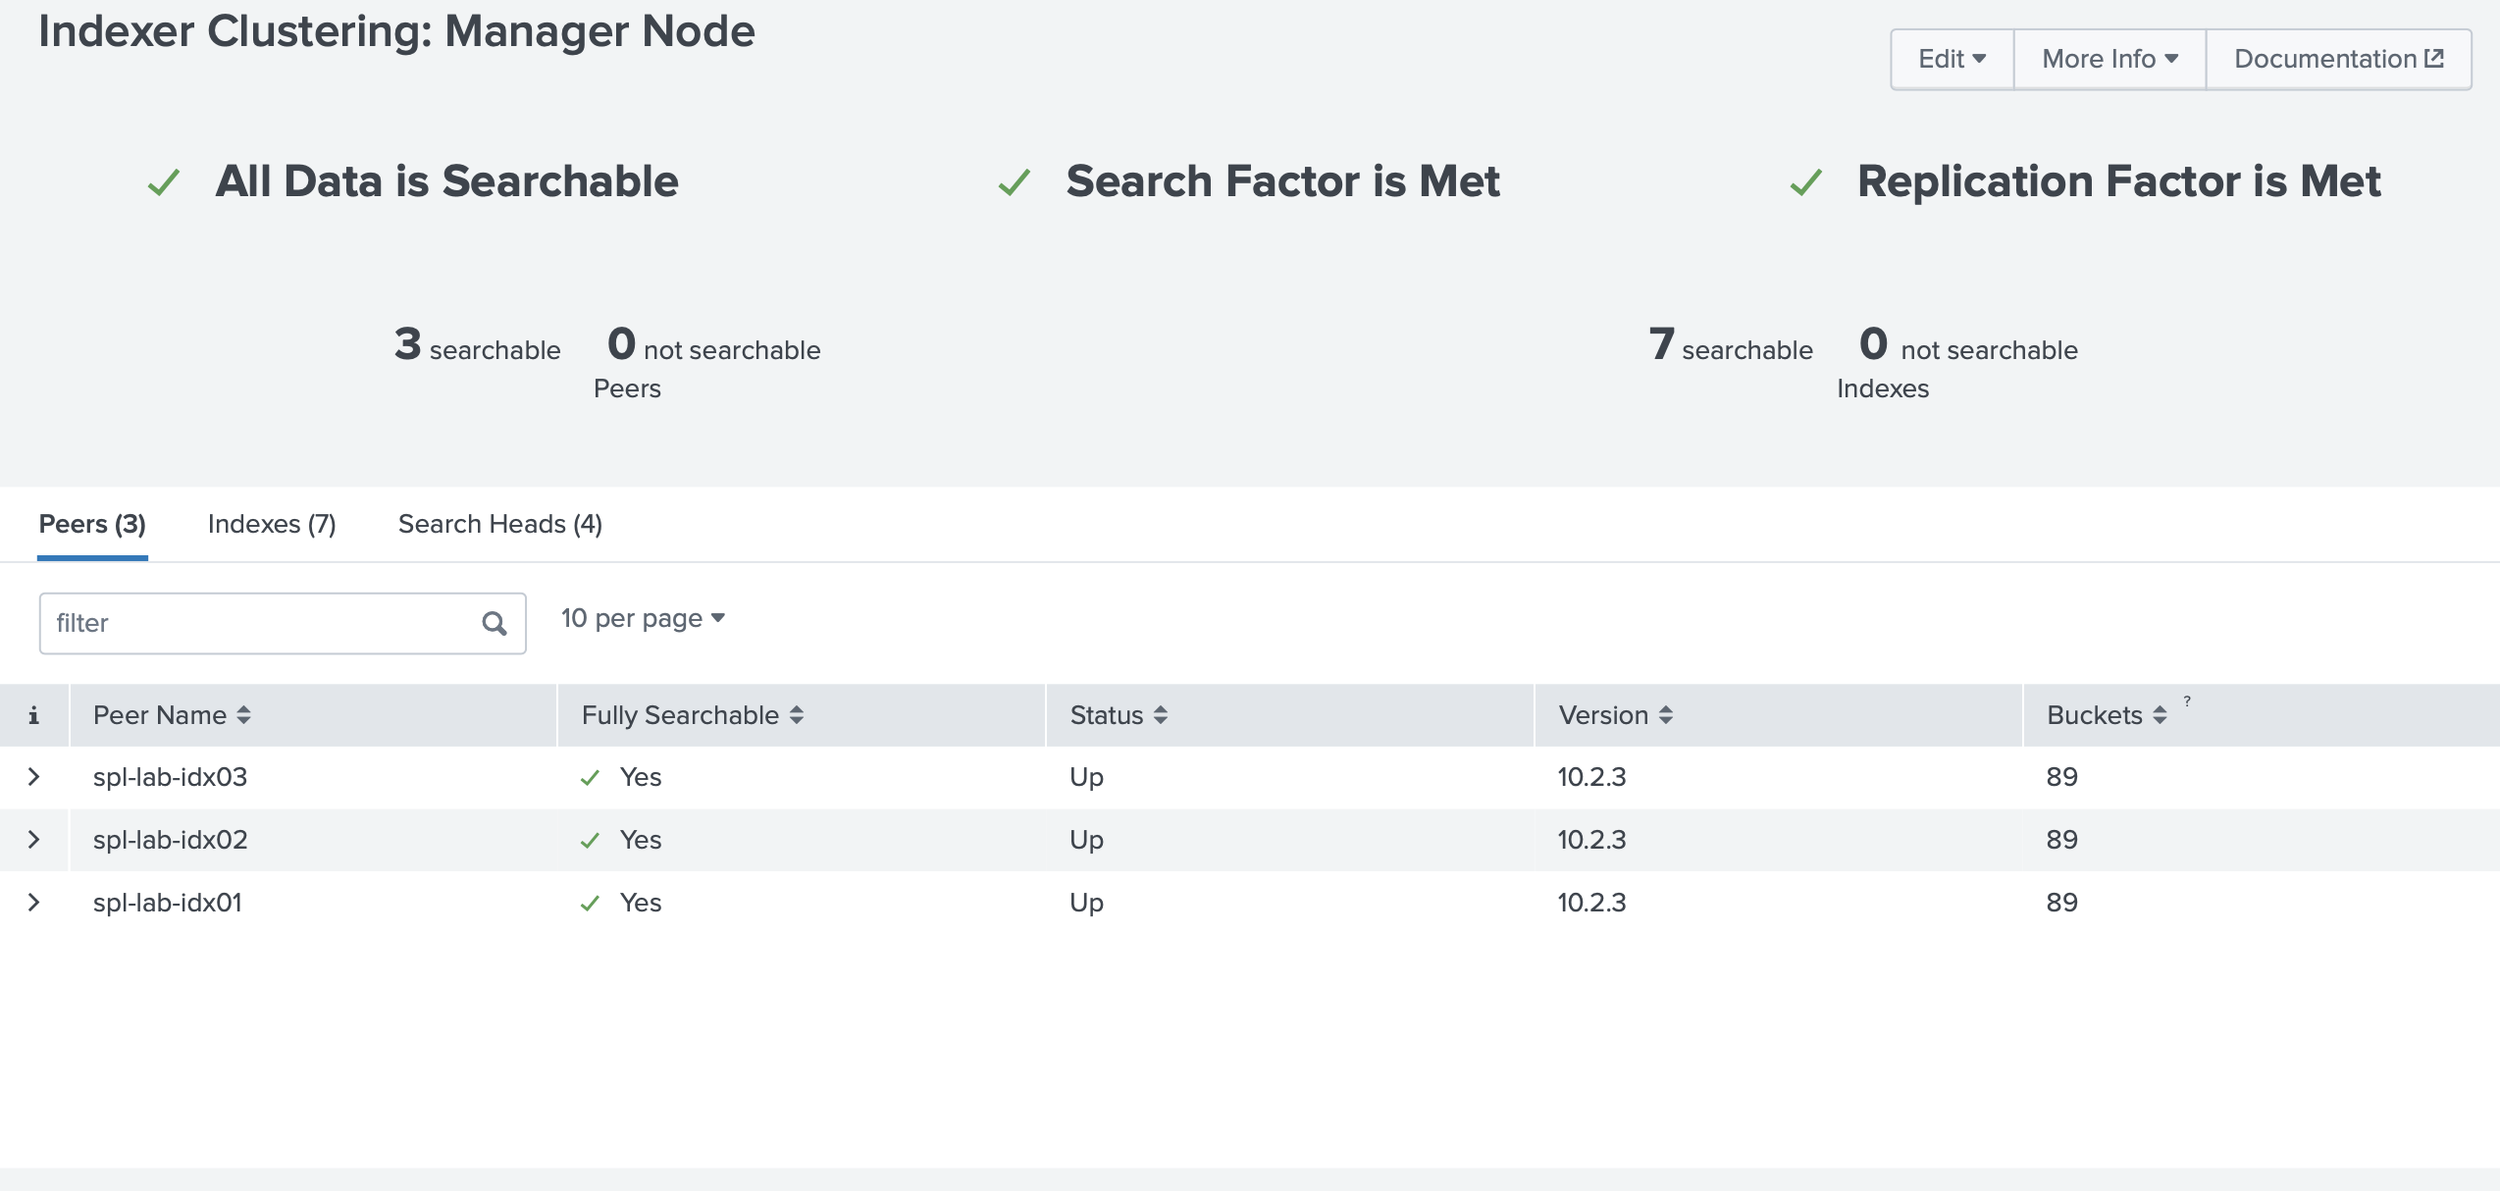
The indexing layer used three indexers, so I could gain additional hands-on experience with the following: clustered indexing, replication factor, search factor, peer relationships, and the difference between receiving data and making it searchable. For security telemetry, that distinction matters. Important logs should not depend on a single indexer, and indexing health affects search completeness and reporting confidence.
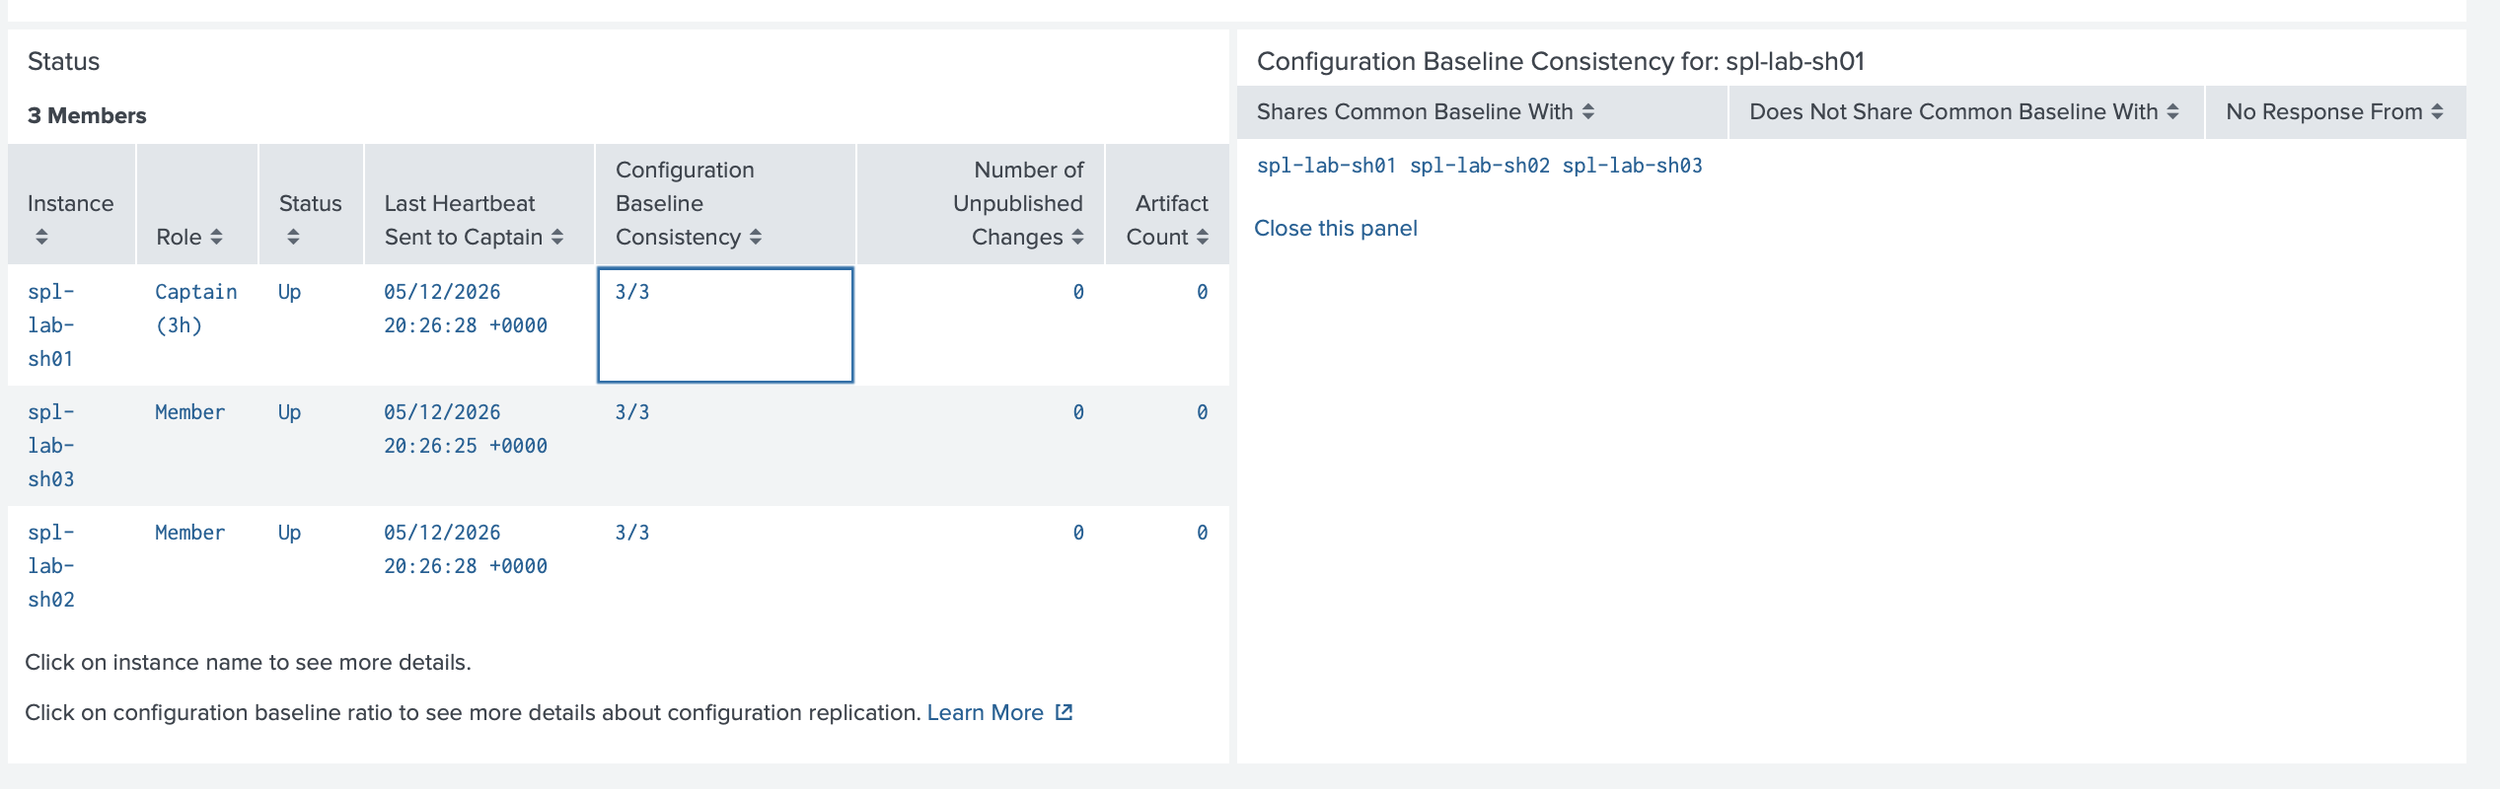
The search layer used three search heads and a Deployer. Search heads are where analysts run investigations, use dashboards, schedule searches, and create or manage knowledge objects. The Deployer sits outside the search head cluster and supports consistent baseline app and certain configuration updates across members. Manual changes can create drift as environments grow.
The deployment layer used a Deployment Server to manage forwarder configurations. Deployment apps and server classes made onboarding repeatable: which forwarders receive which apps, why the configuration exists, and whether others could review it.
The ingestion layer used a Universal Forwarder for lightweight collection and an intermediate forwarder, implemented as a Heavy Forwarder, for justified processing-tier use cases. I treated the Heavy Forwarder as an architectural decision, not a default hop. It can support architecture patterns such as controlled egress or DMZ aggregation, along with Splunk use cases such as routing, filtering, masking before indexing, modular inputs, and selective forwarding. Because it is a Splunk Enterprise instance, it needs sizing, monitoring, patching, access control, and availability planning.
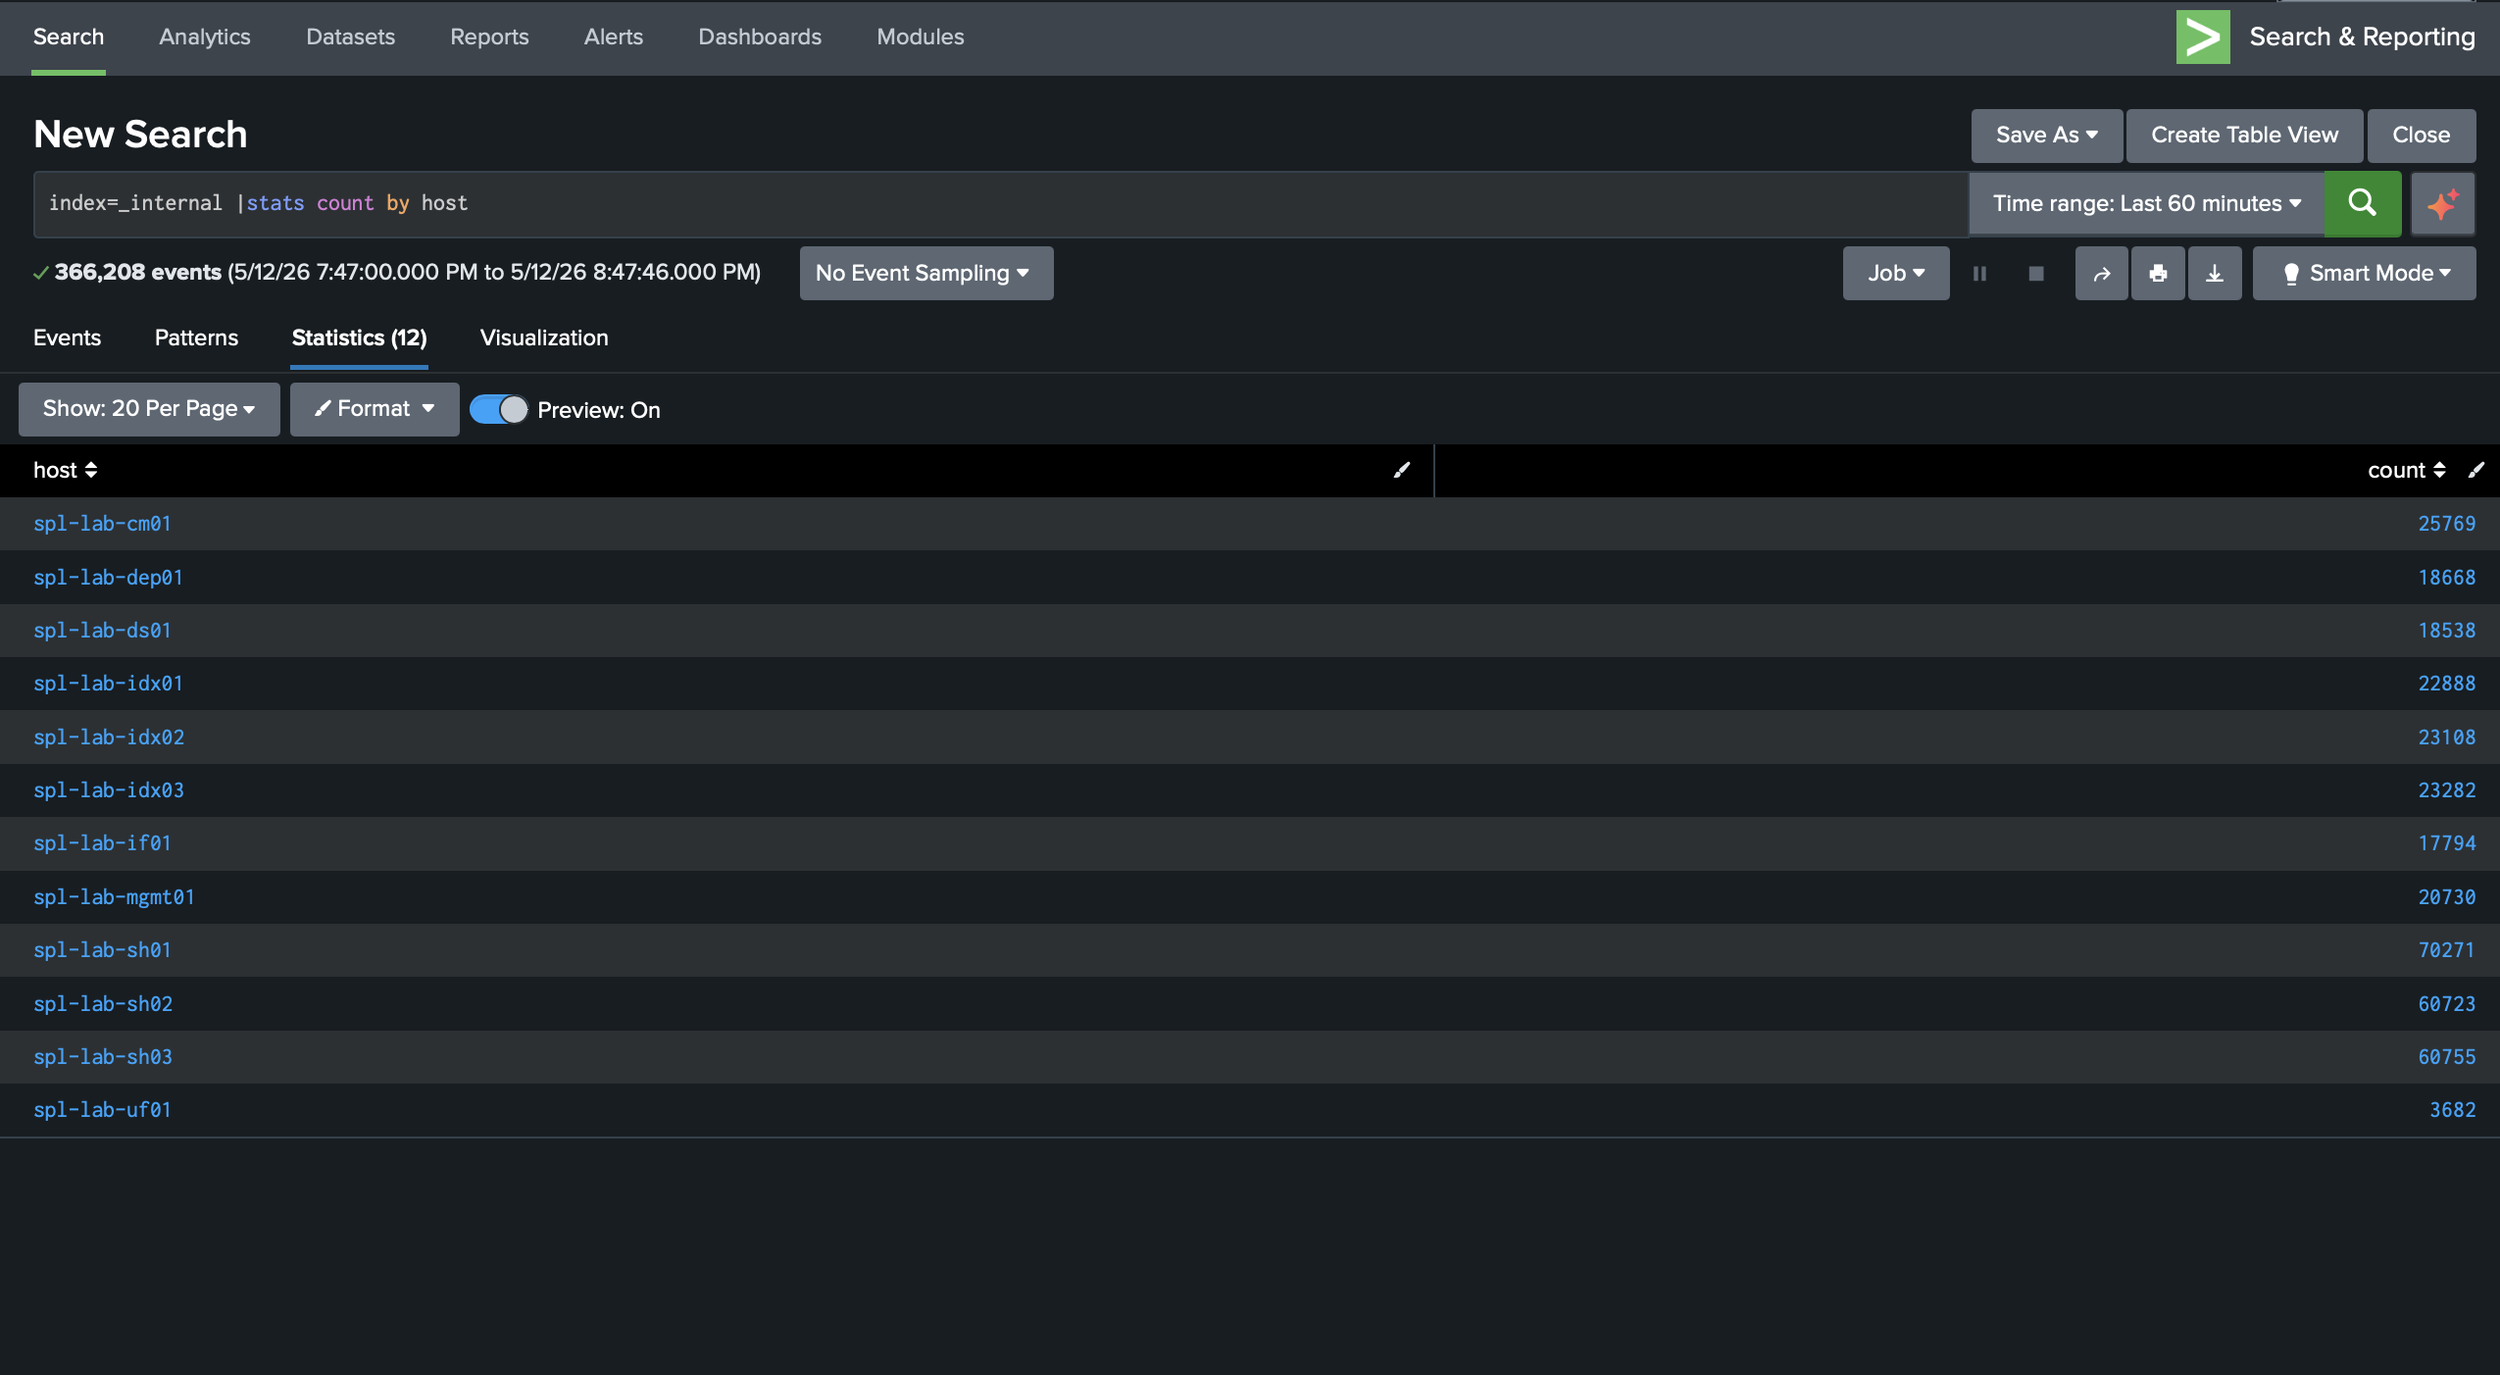
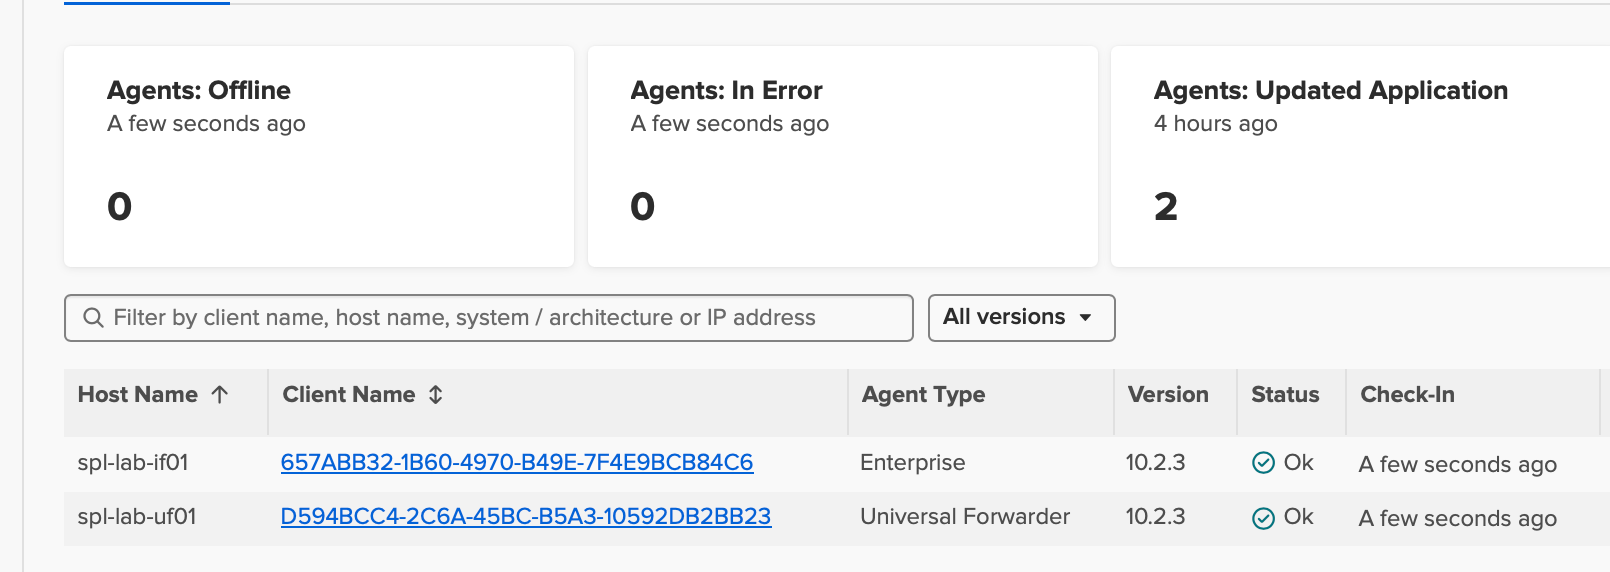
I validated the environment by checking indexer cluster health, search head cluster status, forwarder connections, listening ports, and Splunk internal logs.
Security and Implementation Notes
Many important security decisions happen before a dashboard exists. I treated the lab as a set of trust boundaries: what should be reachable, what should stay private, what should be encrypted, and what assumptions needed verification before I trusted the data in Splunk.
In AWS, security groups were part of the architecture, not just setup details. SSH should be limited to trusted administrative paths, such as Session Manager, a VPN, a bastion host, a known public IP, or a restricted CIDR. Splunk Web should only be reachable where administration or analyst access is needed. Forwarders should only reach receiving systems, and management, clustering, deployment, and search head cluster communication should be limited to the Splunk components that require it.
At the storage layer, I used EBS encryption. Splunk indexes, configuration files, snapshots, and logs can contain hostnames, usernames, internal IP addresses, tokens, detection logic, or other sensitive operational details. Even in a lab, those details are worth protecting because they reflect habits expected in real environments.
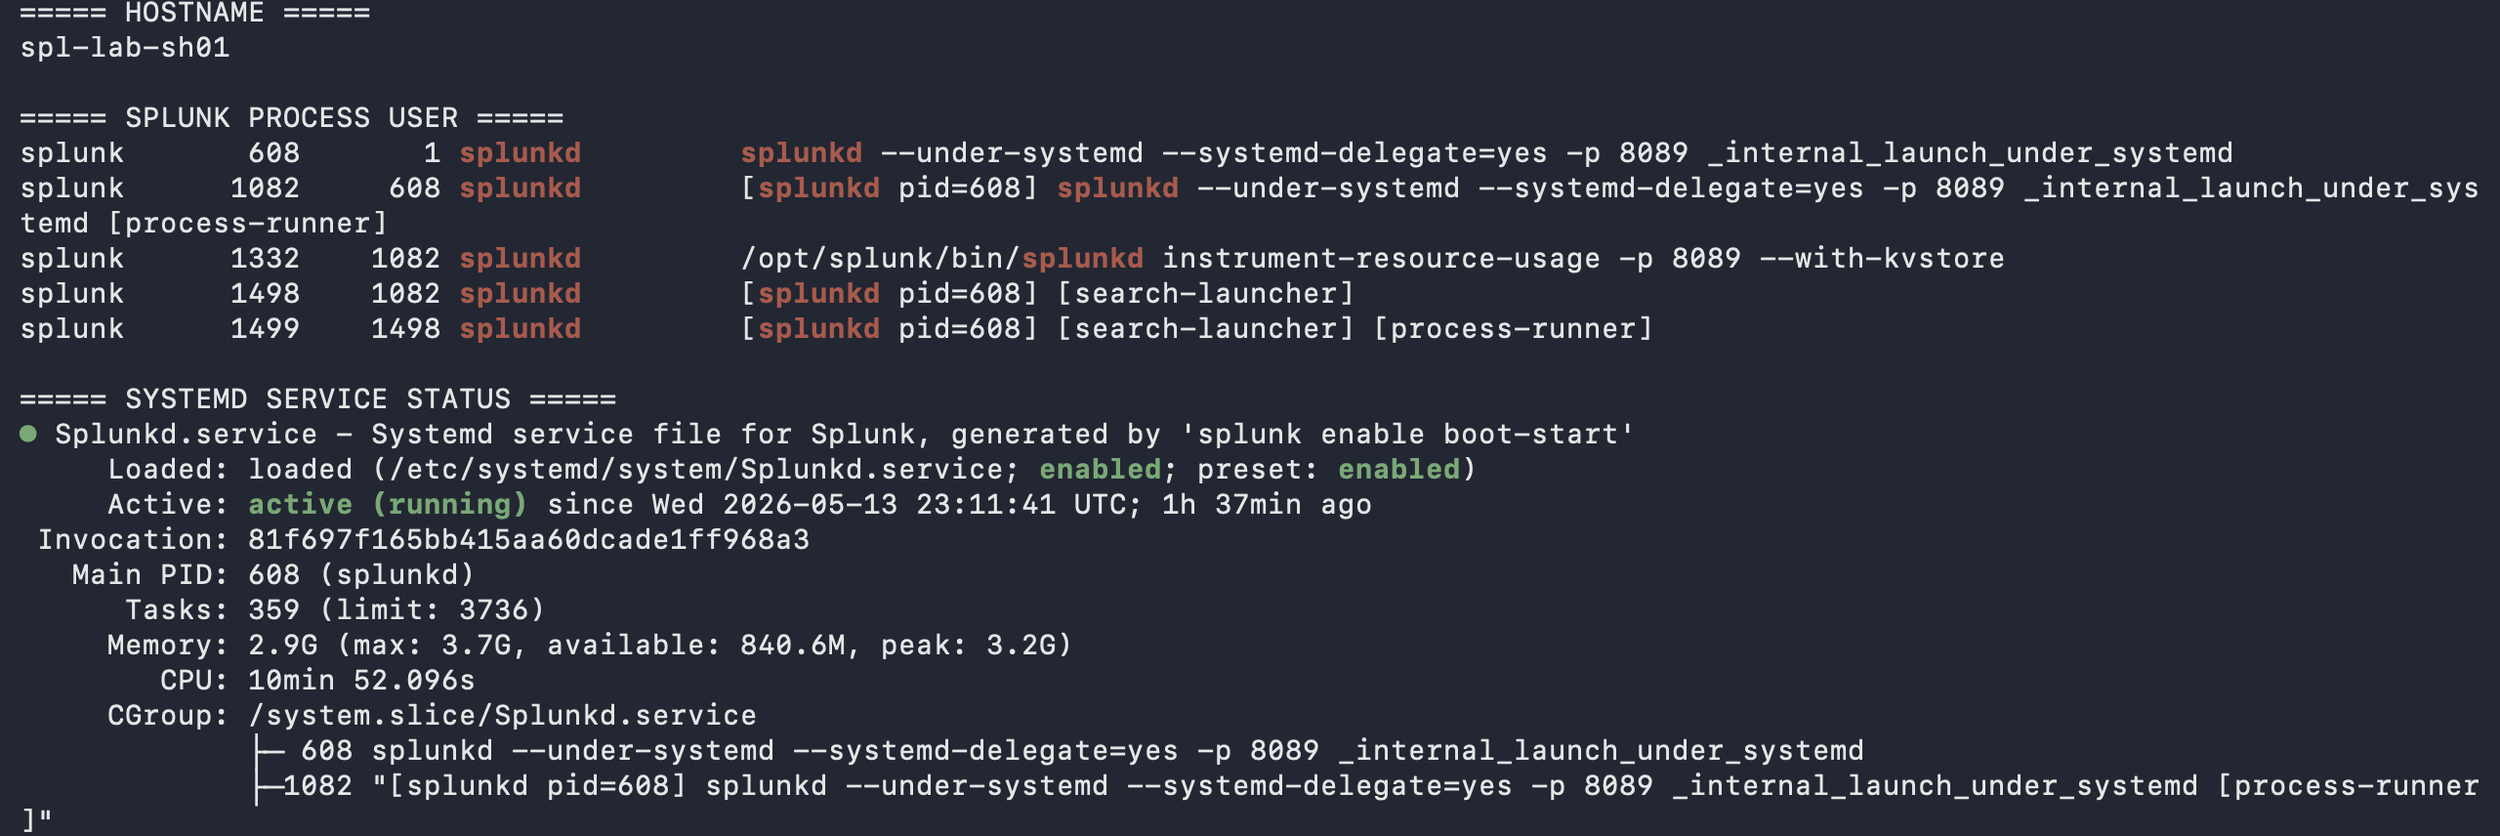
On Ubuntu, I focused on service and host hygiene: running Splunk with a dedicated splunk account, validating ownership under /opt/splunk, using systemd, checking listening ports, reviewing logs, validating disk space, applying updates, checking time synchronization, tuning ulimits, and disabling Transparent Huge Pages based on Splunk documentation. I kept asking whether each host was prepared for its role and whether a Linux administrator could review the system without finding obvious shortcuts.
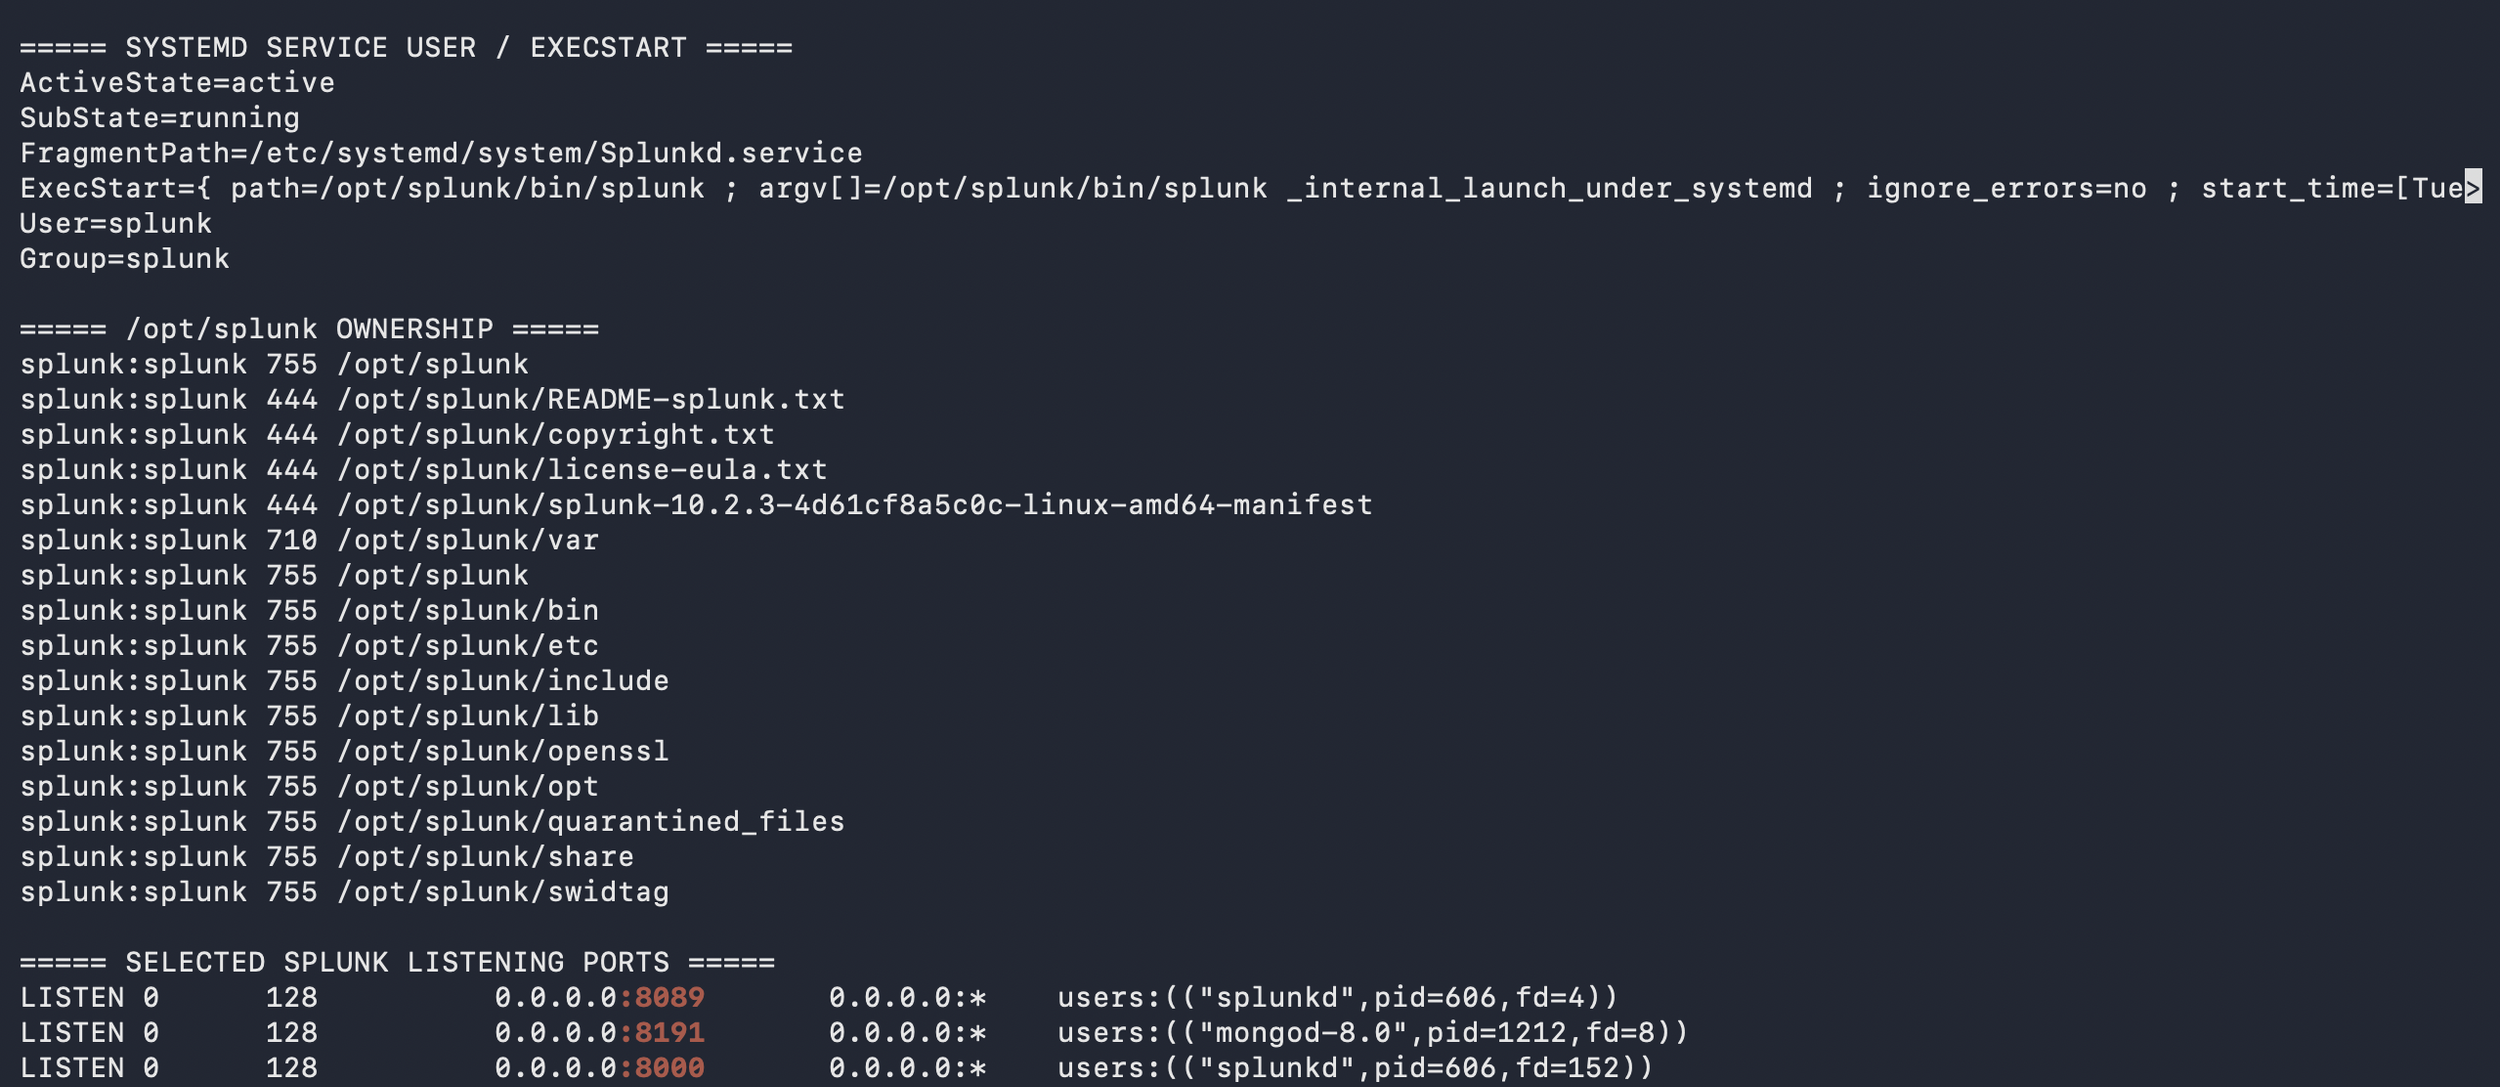
For Splunk, I treated ports as dependencies that needed justification. Ports such as 8000, 8089, 9997, 8088 if enabled, configured replication ports, search head cluster ports, and 8191 for KV Store should map to specific relationships between the Cluster Manager, indexers, search heads, Deployer, Deployment Server, Management Server, Universal Forwarder, and Heavy Forwarder. The point was to justify each path, restrict it appropriately, and validate it against the deployed configuration.
What I Learned
This project helped me think more carefully about SIEM work as a cybersecurity professional. Searches, dashboards, and alerts matter, but they depend on reliable infrastructure behind them. Every detection depends on where data comes from, how it is forwarded, parsed, stored, searched, and monitored.
The build made reliability easier to see in practical terms. A missed permission, open port, unhealthy peer, or unclear forwarding path was not just a configuration issue; it could create a gap in visibility, context, or confidence during an investigation.
The most useful habit was treating each decision as something that should stand up to review. Why does this component exist? Why is this port open? Why centralize this configuration? How would I know if it broke?
I wanted hands-on practice before the Splunk Enterprise Practical Deployment Lab, which I have since passed. Building the full deployment exposed weak areas and troubleshooting patterns that could cost time during the practical. It reminded me to verify with evidence instead of relying on assumptions and reinforced why shared notes, diagrams, mistakes, and walkthroughs can help others notice details they might otherwise miss.
How to Reproduce
To reproduce this lab, start by reviewing current AWS, Ubuntu, and Splunk documentation, because supported versions, instance options, deployment guidance, and best practices change over time. Then build a small AWS VPC with clearly named Ubuntu EC2 instances, role-based security groups, and an access model chosen before deployment: Session Manager, VPN, bastion host, or tightly scoped SSH.
Install Splunk Enterprise with a dedicated splunk user, configure systemd, and validate ownership, ulimits, disabling Transparent Huge Pages, service status, time synchronization, listening ports, and disk capacity before adding complexity. Keep a simple build map that ties each instance to its role, required ports, security group rules, and validation checks.
Build the indexer cluster around the Cluster Manager, then add the three search heads and Deployer. Add the Management Server for the License Manager and Monitoring Console, followed by the Deployment Server, Universal Forwarder, and intermediate Heavy Forwarder where each role has a clear purpose. Validate each layer: cluster health, port reachability, deployment app status, forwarder connections, and test events landing with expected index, host, source, and sourcetype values.
Document what changed, why it changed, how it was validated, and what broke. That documentation supports troubleshooting and helps turn a personal build into something another person can understand, question, and learn from.
Next Improvements
The next phase is security telemetry expansion. I will start with Ubuntu authentication and web server logs to practice host and application visibility, then add AWS CloudTrail for control-plane activity and VPC Flow Logs for network communication patterns.
After that, I will focus on detection engineering: suspicious authentication, administrative changes, unusual outbound connections, command execution, persistence, and missing-data conditions. Each detection should include a data source, SPL logic, expected behavior, false-positive notes, and validation evidence.
The following phase will focus on runbooks, failure testing, backup planning, certificate hardening, infrastructure as code, and AI-assisted workflows using lab data only, with no production secrets, least privilege, scoped IAM, logging, and human review.
Conclusion
This Splunk AWS homelab gave me a practical way to connect secure design, reliable visibility, troubleshooting, and documentation. It was not only a Splunk build. It also involved AWS architecture, Ubuntu administration, data pipeline design, and security operations thinking.
I came away with a stronger understanding of how the cloud layer, host layer, Splunk roles, forwarding paths, parsing choices, and validation steps affect the quality of security data. A well-designed Splunk homelab gives me a foundation I can keep extending with new technologies, log sources, detections, dashboards, reports, and automation.
The most important takeaway was the value of deliberate practice. I want to keep building, ask better questions, and share what I learn in a way that is useful to others. I benefited from people who shared their homelabs, notes, diagrams, mistakes, and lessons online. As stated previously, if this post helps one person make a more secure design choice, validate one more layer, or ask a better question before opening a port or onboarding a data source, then it served its purpose.
I am continuing to expand this lab with AWS telemetry, detection content, dashboards, runbooks, and automation. If you work in Splunk, detection engineering, SOC operations, or cloud security, I would be glad to connect, compare approaches, and learn from your feedback.
The views expressed here are my own and do not represent any employer or organization.